Visualizing and analyzing HR data with ChartBase
December 29, 2022 — 3 min readhrdataanalysisnotionchartbase
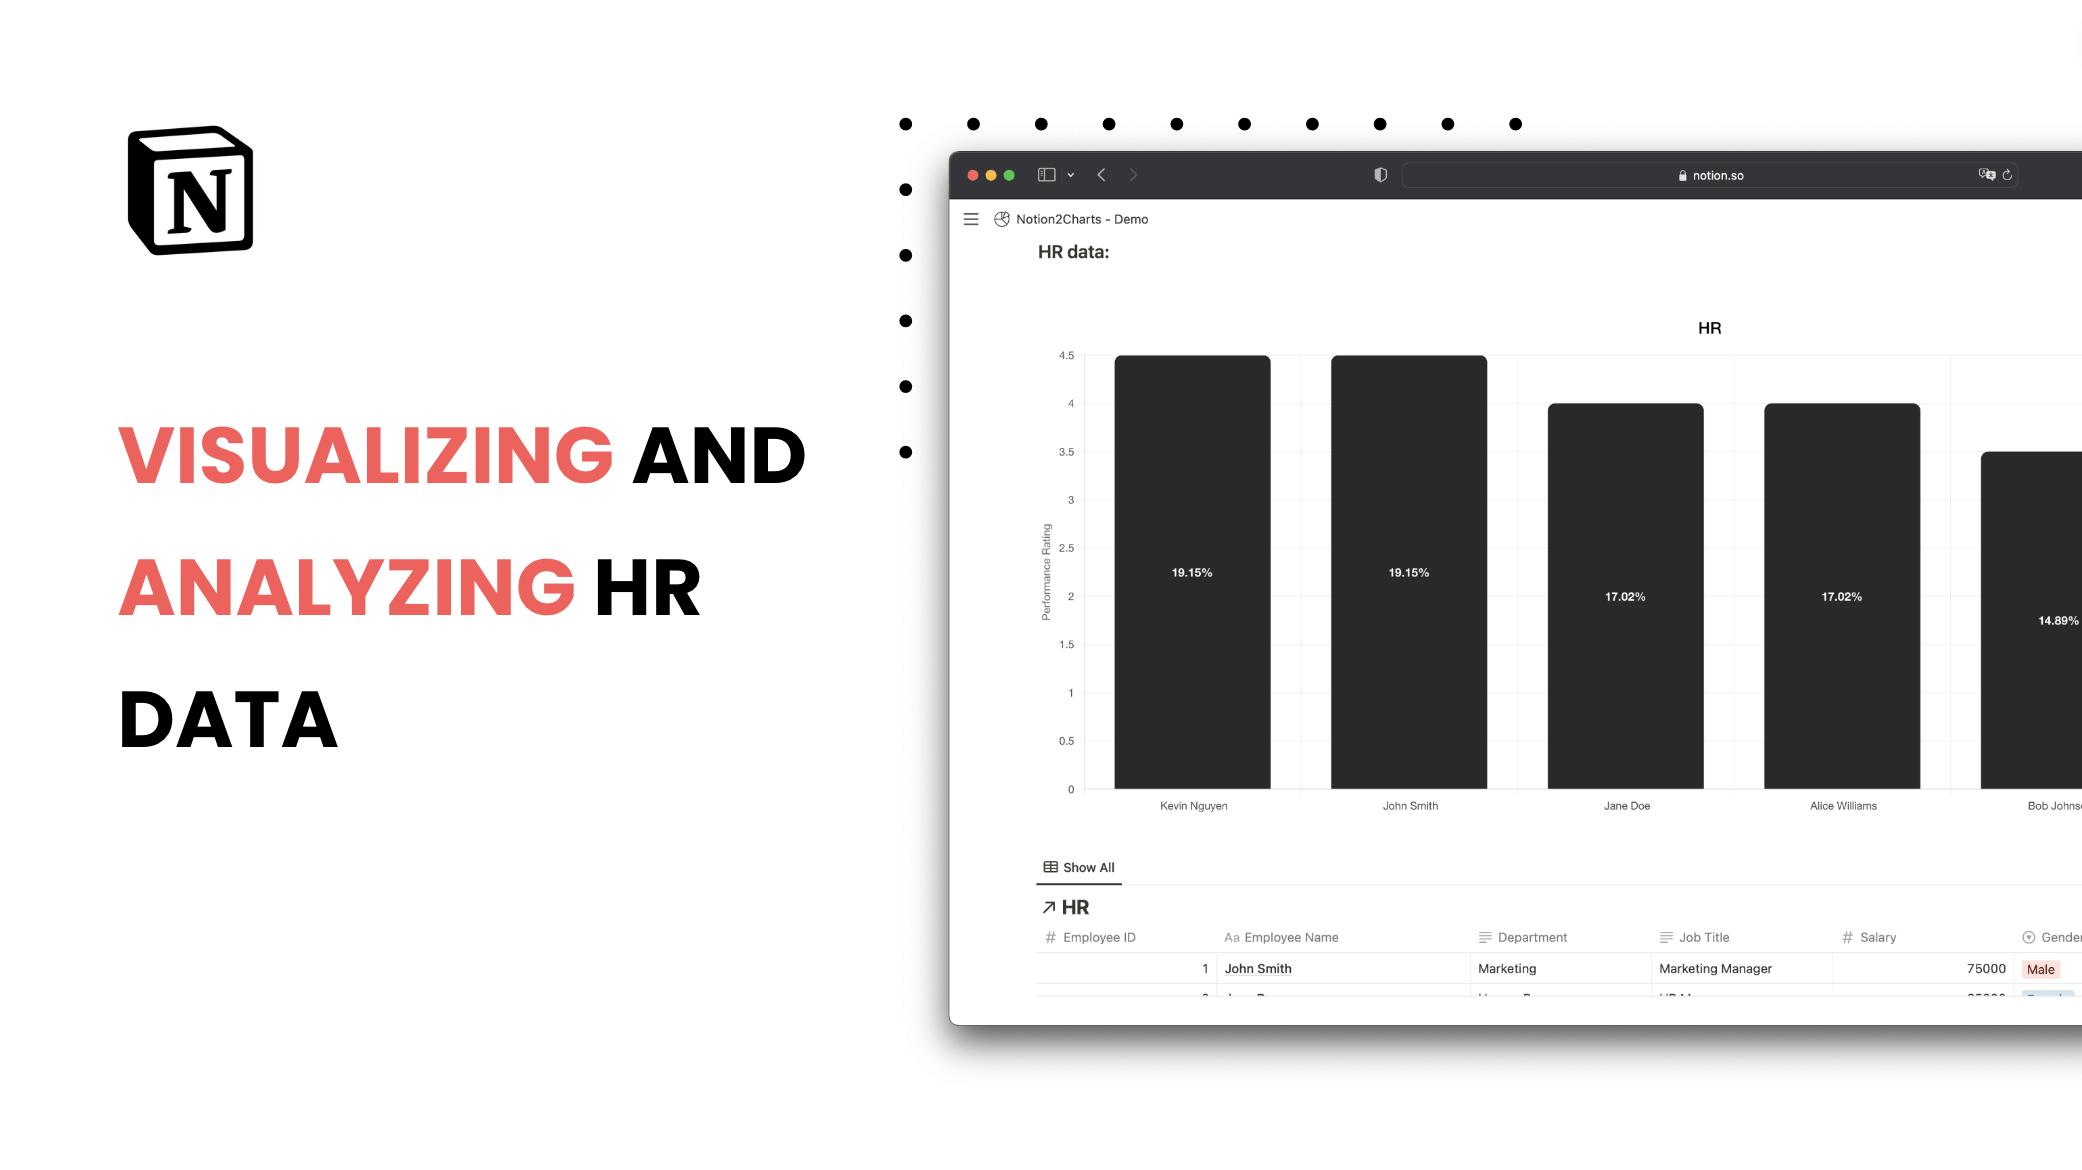
Why visualize and analyze HR data in Notion?
Visualizing and analyzing HR data in Notion can be a valuable tool for HR professionals, managers, and employees. It allows you to monitor and track key HR metrics, such as employee performance, retention, and satisfaction, and make data-driven decisions to improve HR processes and outcomes.
What are the benefits of using ChartBase for HR data?
ChartBase offers a number of benefits for visualizing and analyzing HR data in Notion, including:
- Support for a variety of chart types, including bar, line, pie, and horizontal bar charts, so you can choose the best visualization for your data
- Customization options, such as the ability to change chart labels, colors, and axes, so you can create charts that are easy to understand and interpret
- Sorting and filtering options, so you can focus on the data that is most relevant to your needs
- Collaboration tools, such as the ability to share charts with colleagues and discuss HR data in Notion
How to visualize and analyze HR data in Notion with ChartBase
Here are the steps for visualizing and analyzing HR data in Notion with ChartBase:
1. Create a table in Notion to track HR data
To begin, create a table in Notion to track HR data. The table should include columns for employee name, performance rating, retention rate, and date, as well as any additional data that is relevant to your needs. For example, you may want to include columns for employee satisfaction survey results, training completion rates, or salary data.
2. Connect your Notion workspace to ChartBase
Next, connect your Notion workspace to ChartBase by clicking on the "Connect to Notion" button and granting access to the table containing your HR data. This will allow ChartBase to access and visualize the data in your table.
3. Create a new chart in ChartBase
Once you have connected your Notion workspace to ChartBase, you can create a new chart by clicking on the "Plus" button in the chart builder. Select the type of chart you want to create (e.g. bar chart), the table containing your HR data, and the chart settings (e.g. employee name as the x-axis, performance rating as the y-axis).
4. Customize the chart
You can customize the chart in a number of ways to better suit your needs. For example, you can change the chart type, labels, colors, and axes, as well as sort and filter the data. This will allow you to create charts that are easy to understand and interpret.
5. Share and collaborate on the chart
Once you have created the chart, you can share it with colleagues and collaborate on the data in Notion. This will allow you to discuss HR data and make data-driven decisions together.
6. Embed the chart in your Notion page
You can also embed the chart in your Notion page by pasting the URL of the chart into the Notion page and clicking on the "Embed" button. This will allow you to display the chart directly on the page, where it can be viewed by anyone with access to the page.
Conclusion
In this article, we have shown you how to use ChartBase to visualize and analyze HR data in Notion. By using this tool, you can easily monitor and track key HR metrics and make data-driven decisions to improve HR processes and outcomes. Happy charting!
Latest Posts
Notion Charts: 7 Ways to Make Graphs in Notion
We share the best ways to turn databses into Charts - from ChartBase to LucidChart to GRID, we cover it all.
How to Create Charts in Notion: A Step-by-Step Guide
In Notion, you can't create graphs or charts from tables yet. In this article, we will show you how to create beautiful, dynamic charts from your Notion database using ChartBase, a tool that allows yo