How to Create Charts in Notion: A Step-by-Step Guide
January 2, 2023 — 4 min readchartsnotiondatabaseChartBase
Introduction
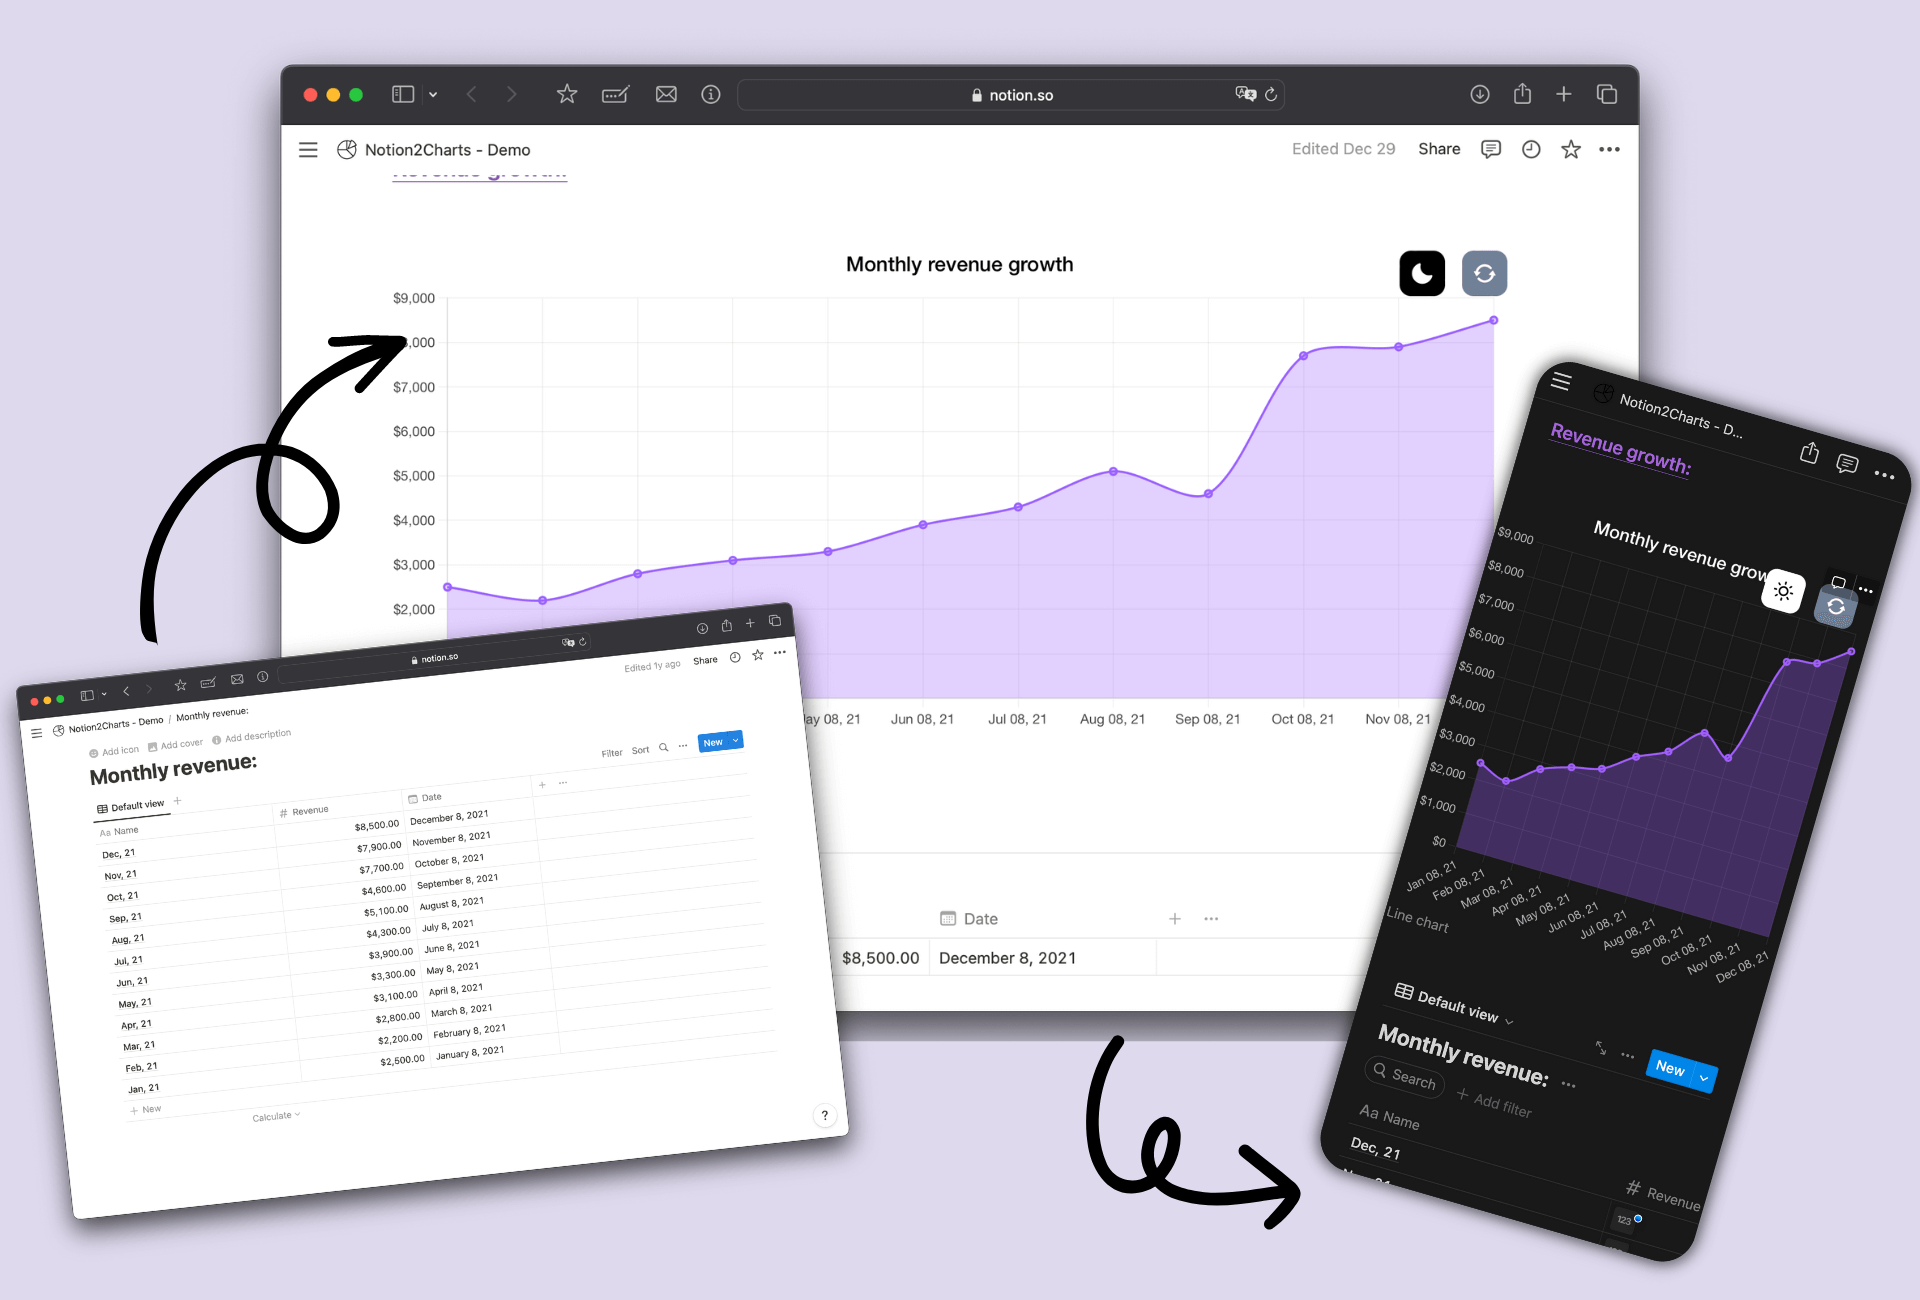
Graphs and charts are a great way to visualize data and make it easy to understand and share with others. Unfortunately, Notion does not currently have native support for creating charts from tables. However, there is a tool called ChartBase that allows you to create a wide range of charts from your Notion tables without any coding required.
In this step-by-step guide, we will show you how to use ChartBase to create and customize charts from your Notion data, and how to embed those charts in a Notion page. We will also provide tips and best practices for using charts effectively in Notion.
Step 1: Setup Your Account
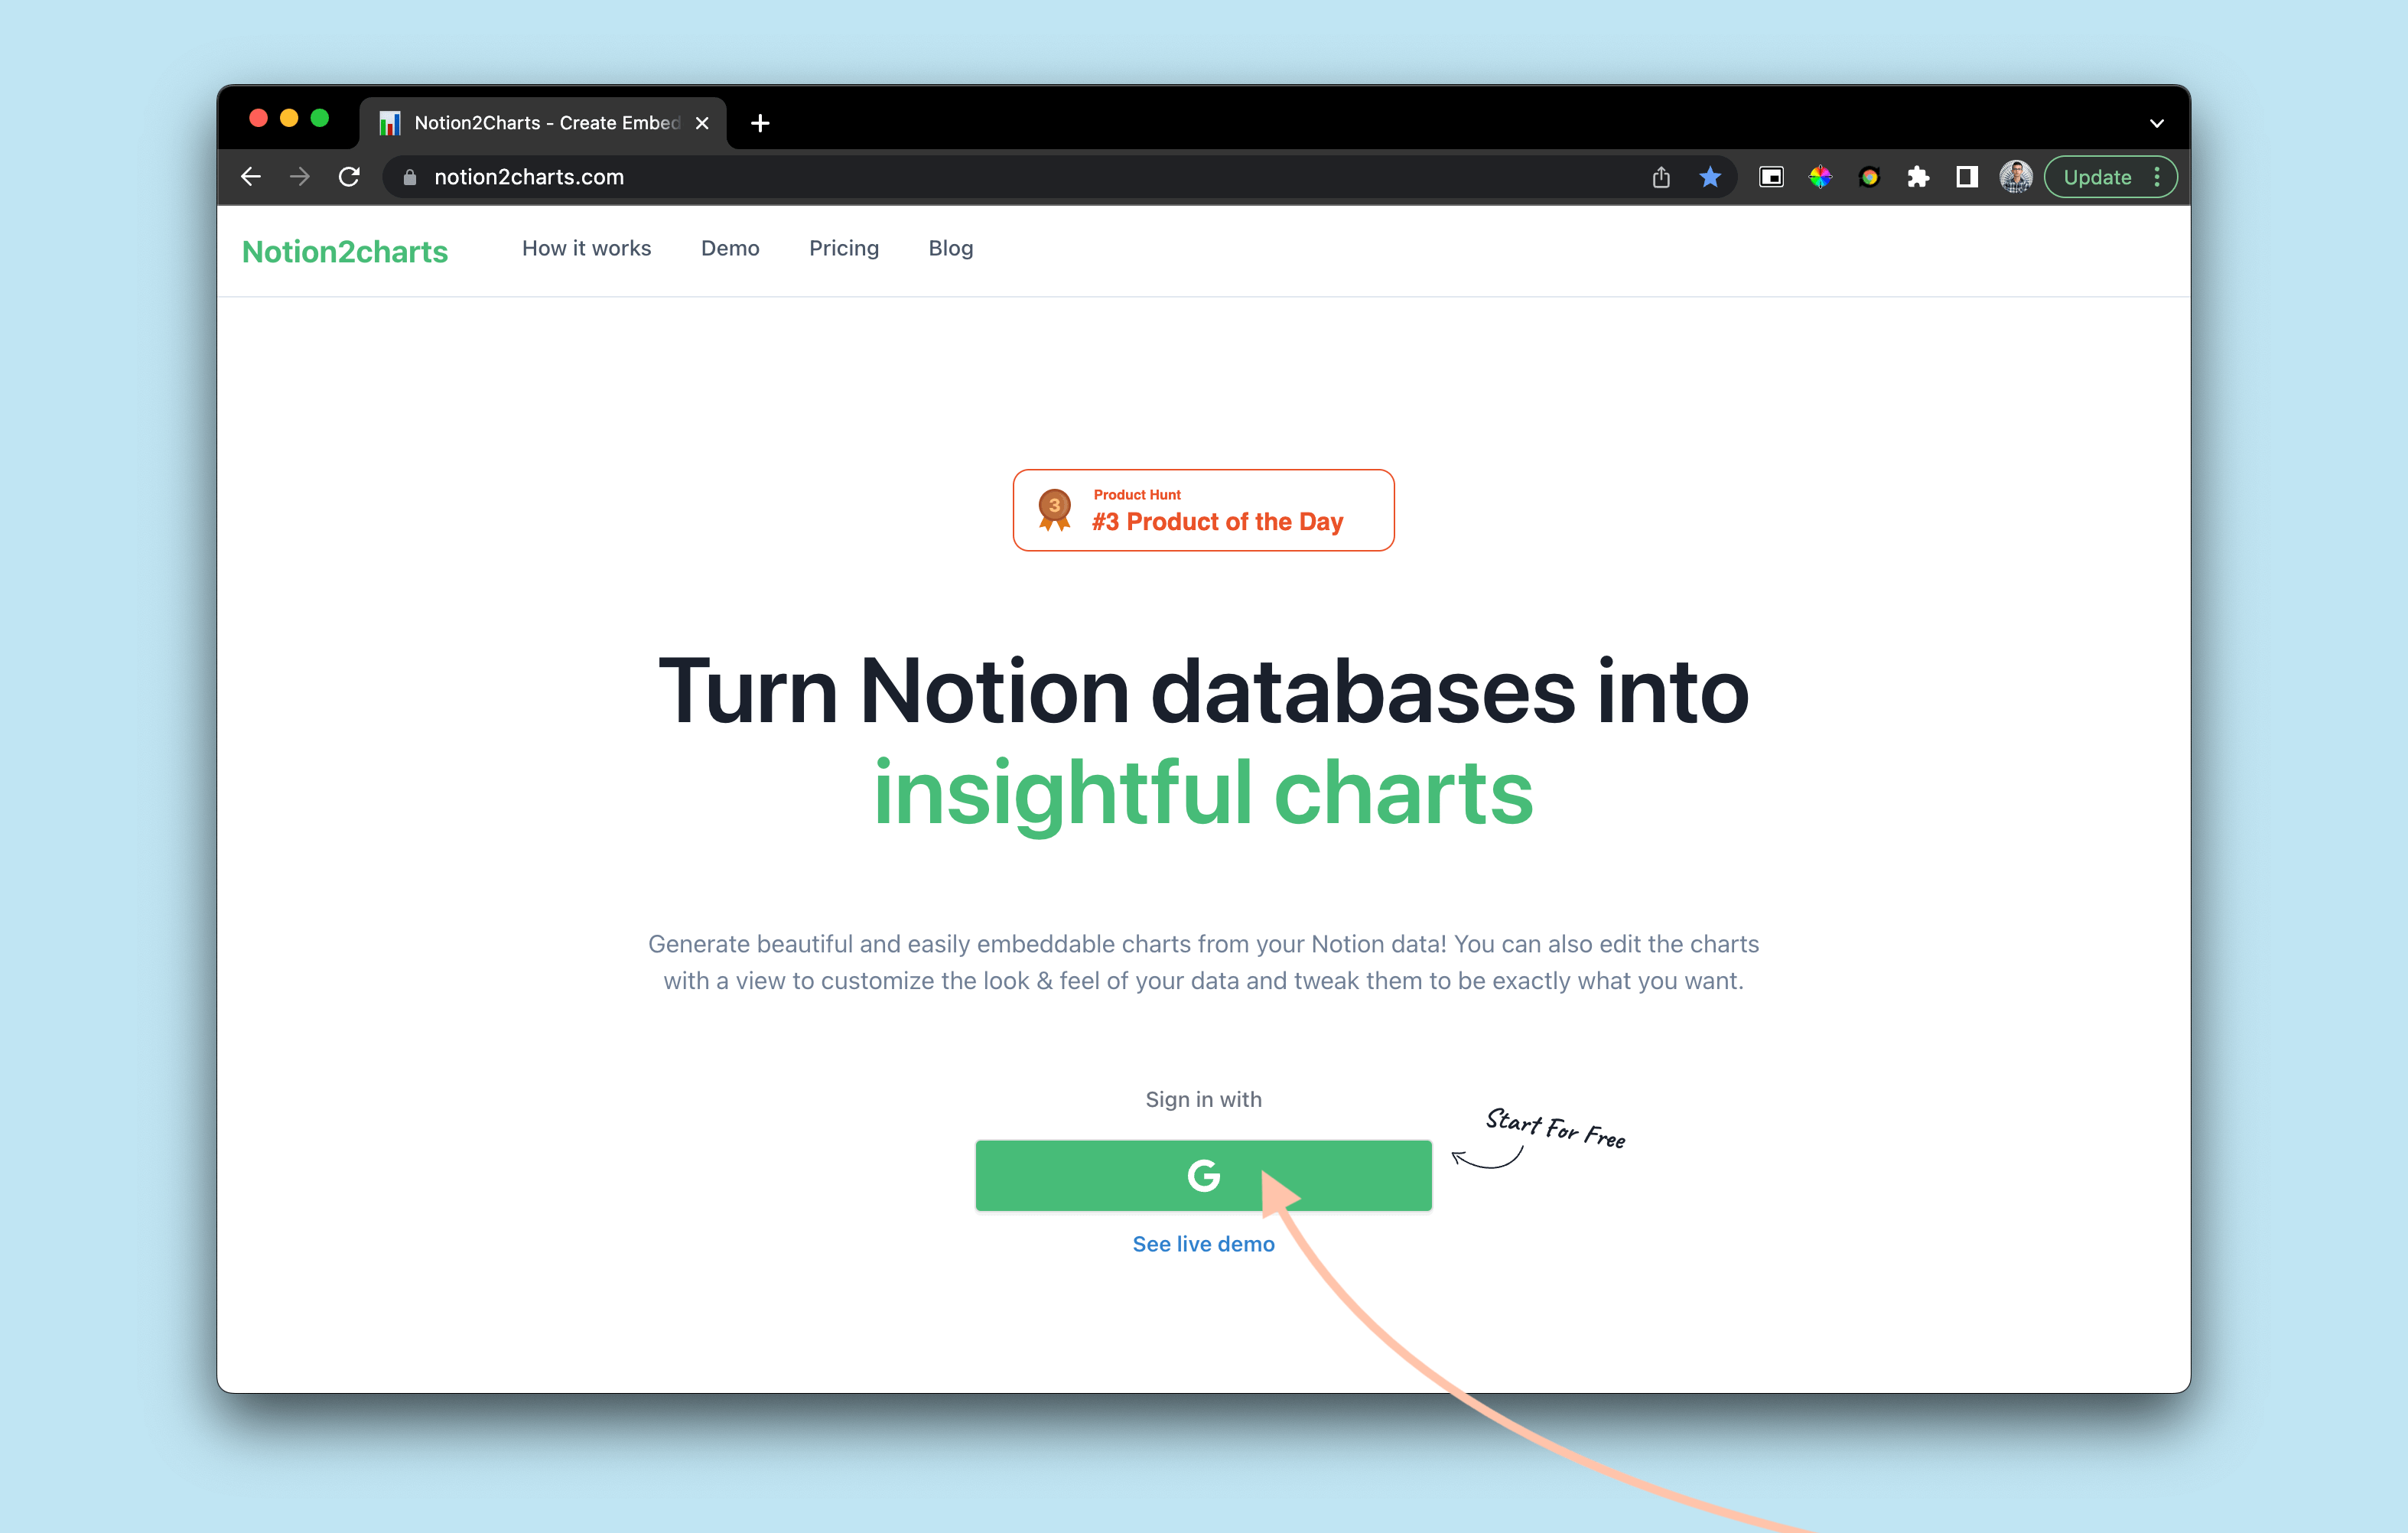
To get started, you need to create an account on ChartBase by clicking on the "Sign in" button. You'll then be redirected to the home page after successfully signing in.
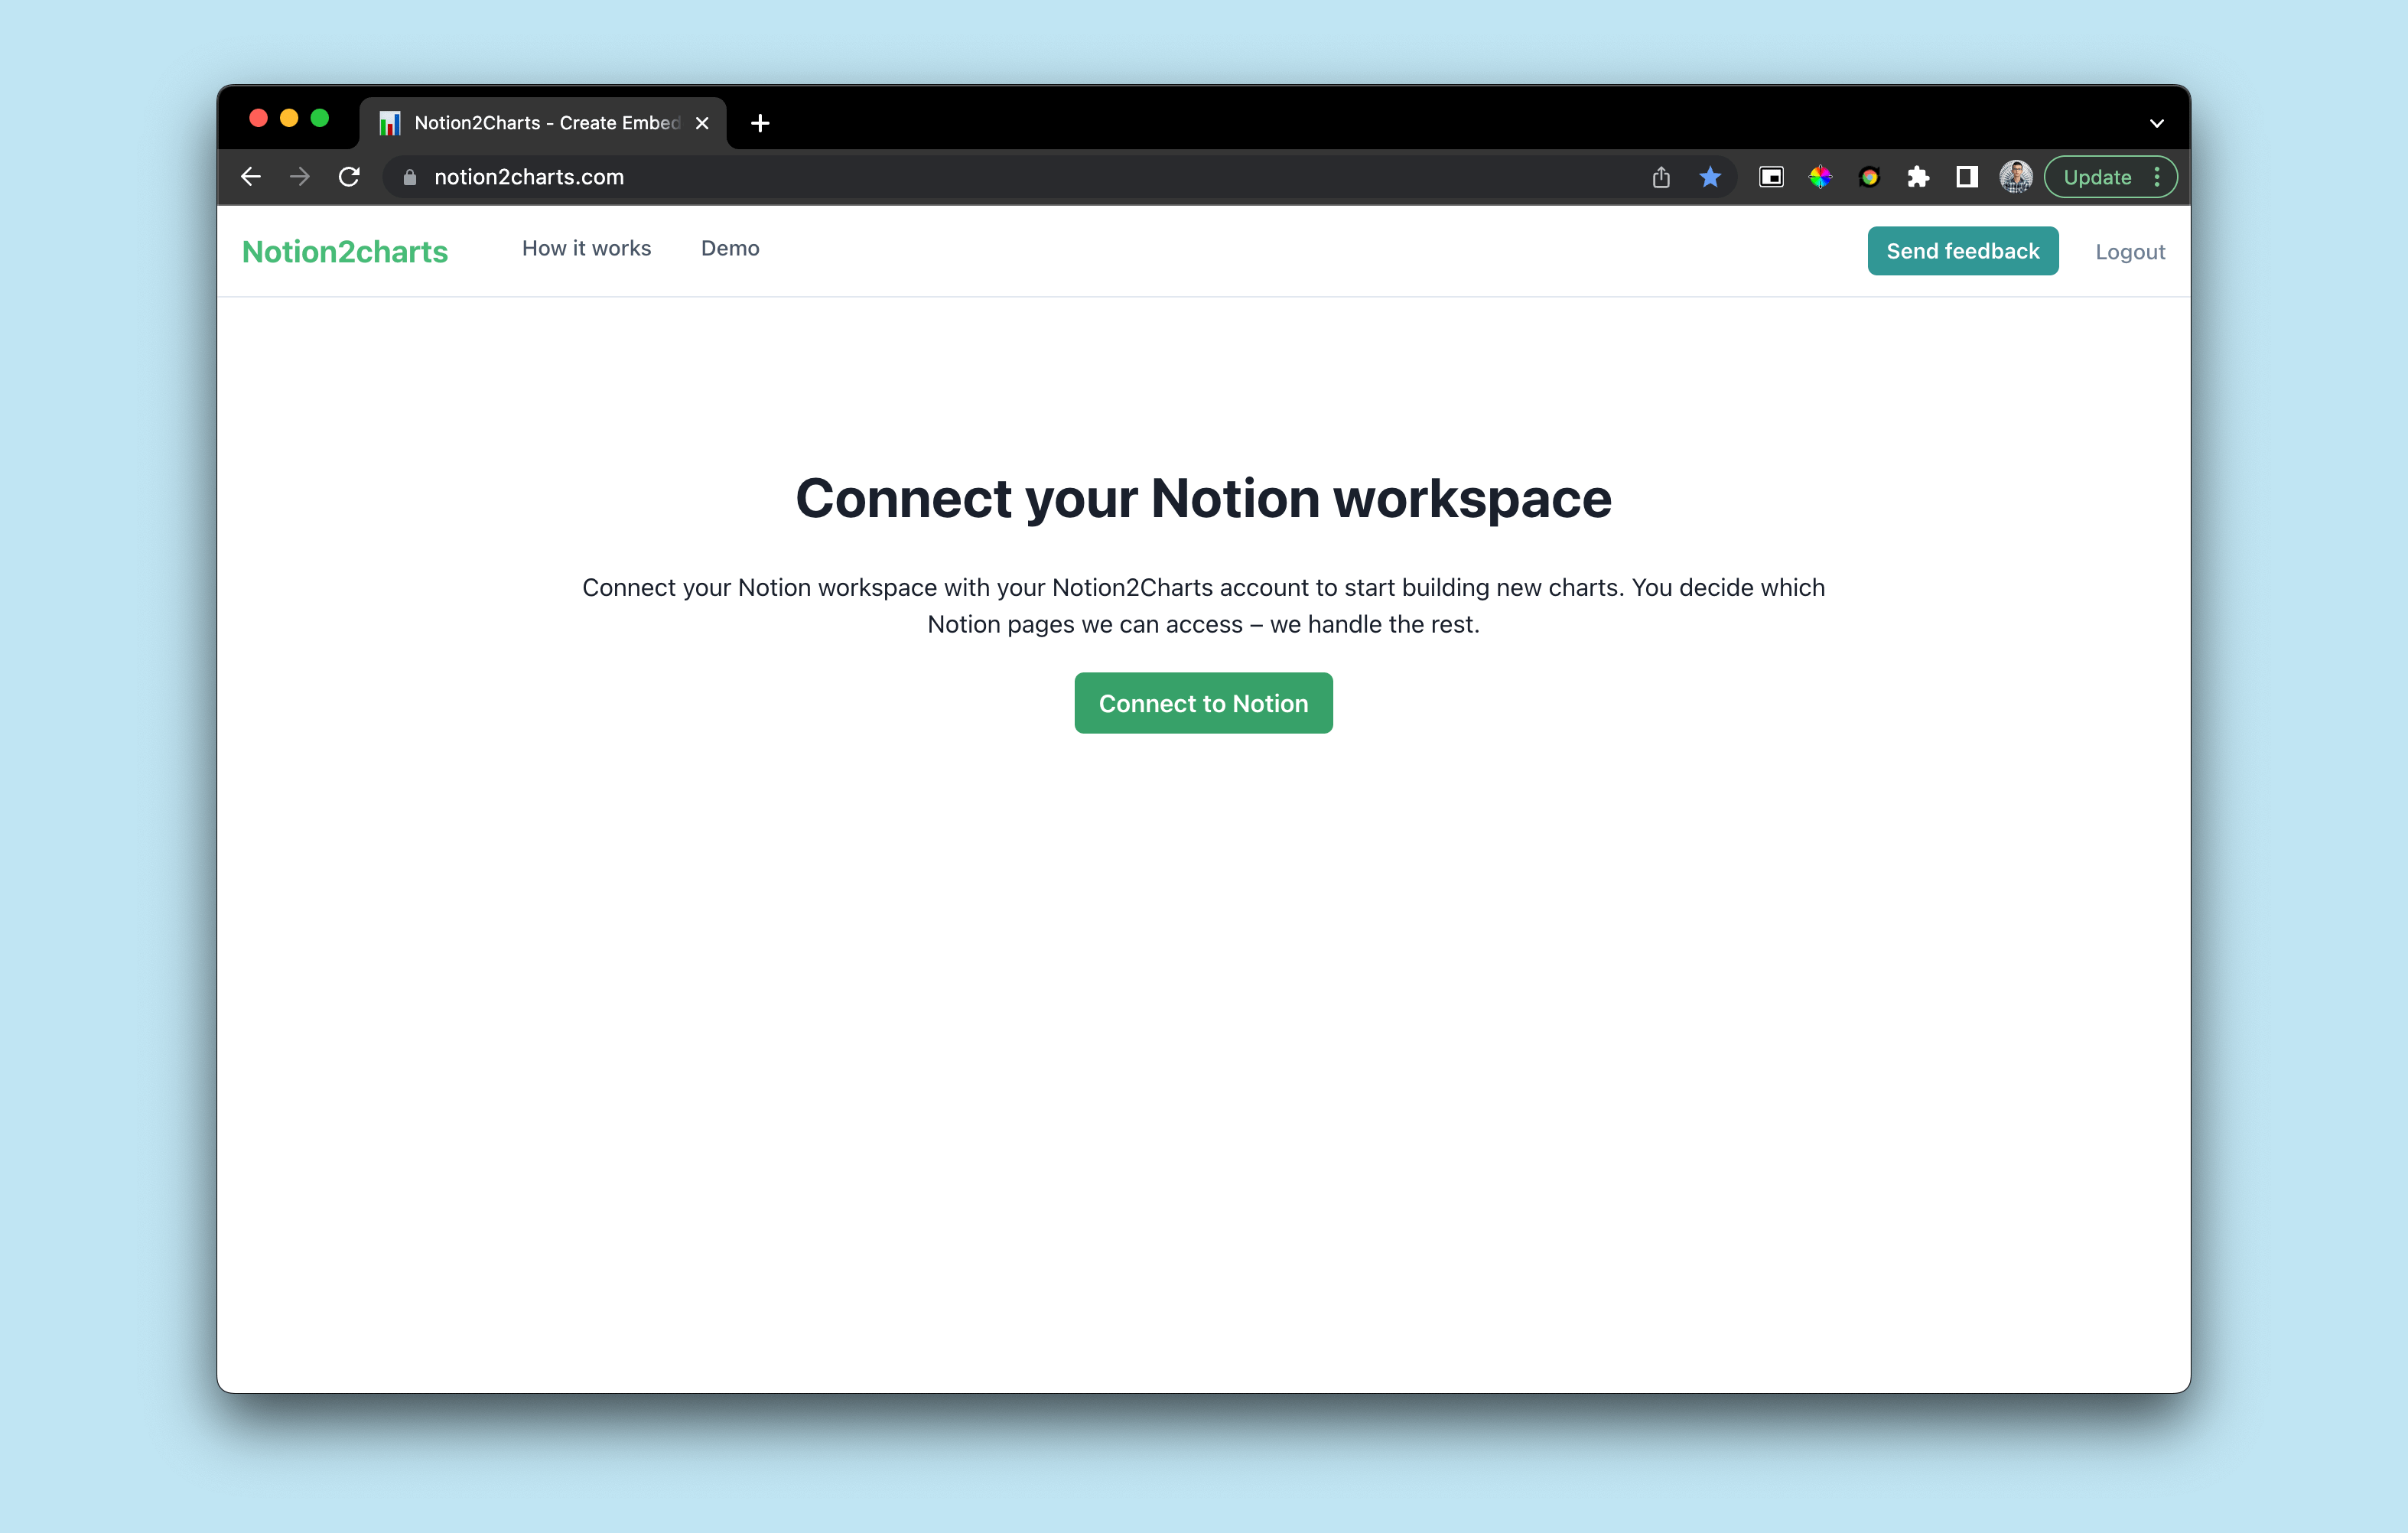
Once you're signed in, you will see a button that says "Connect to Notion". Click on this button to connect your Notion workspace to ChartBase.
In this step, you'll be asked to select the Notion pages you'd like to share with ChartBase. It's important to select the pages you want to share or select all of them.
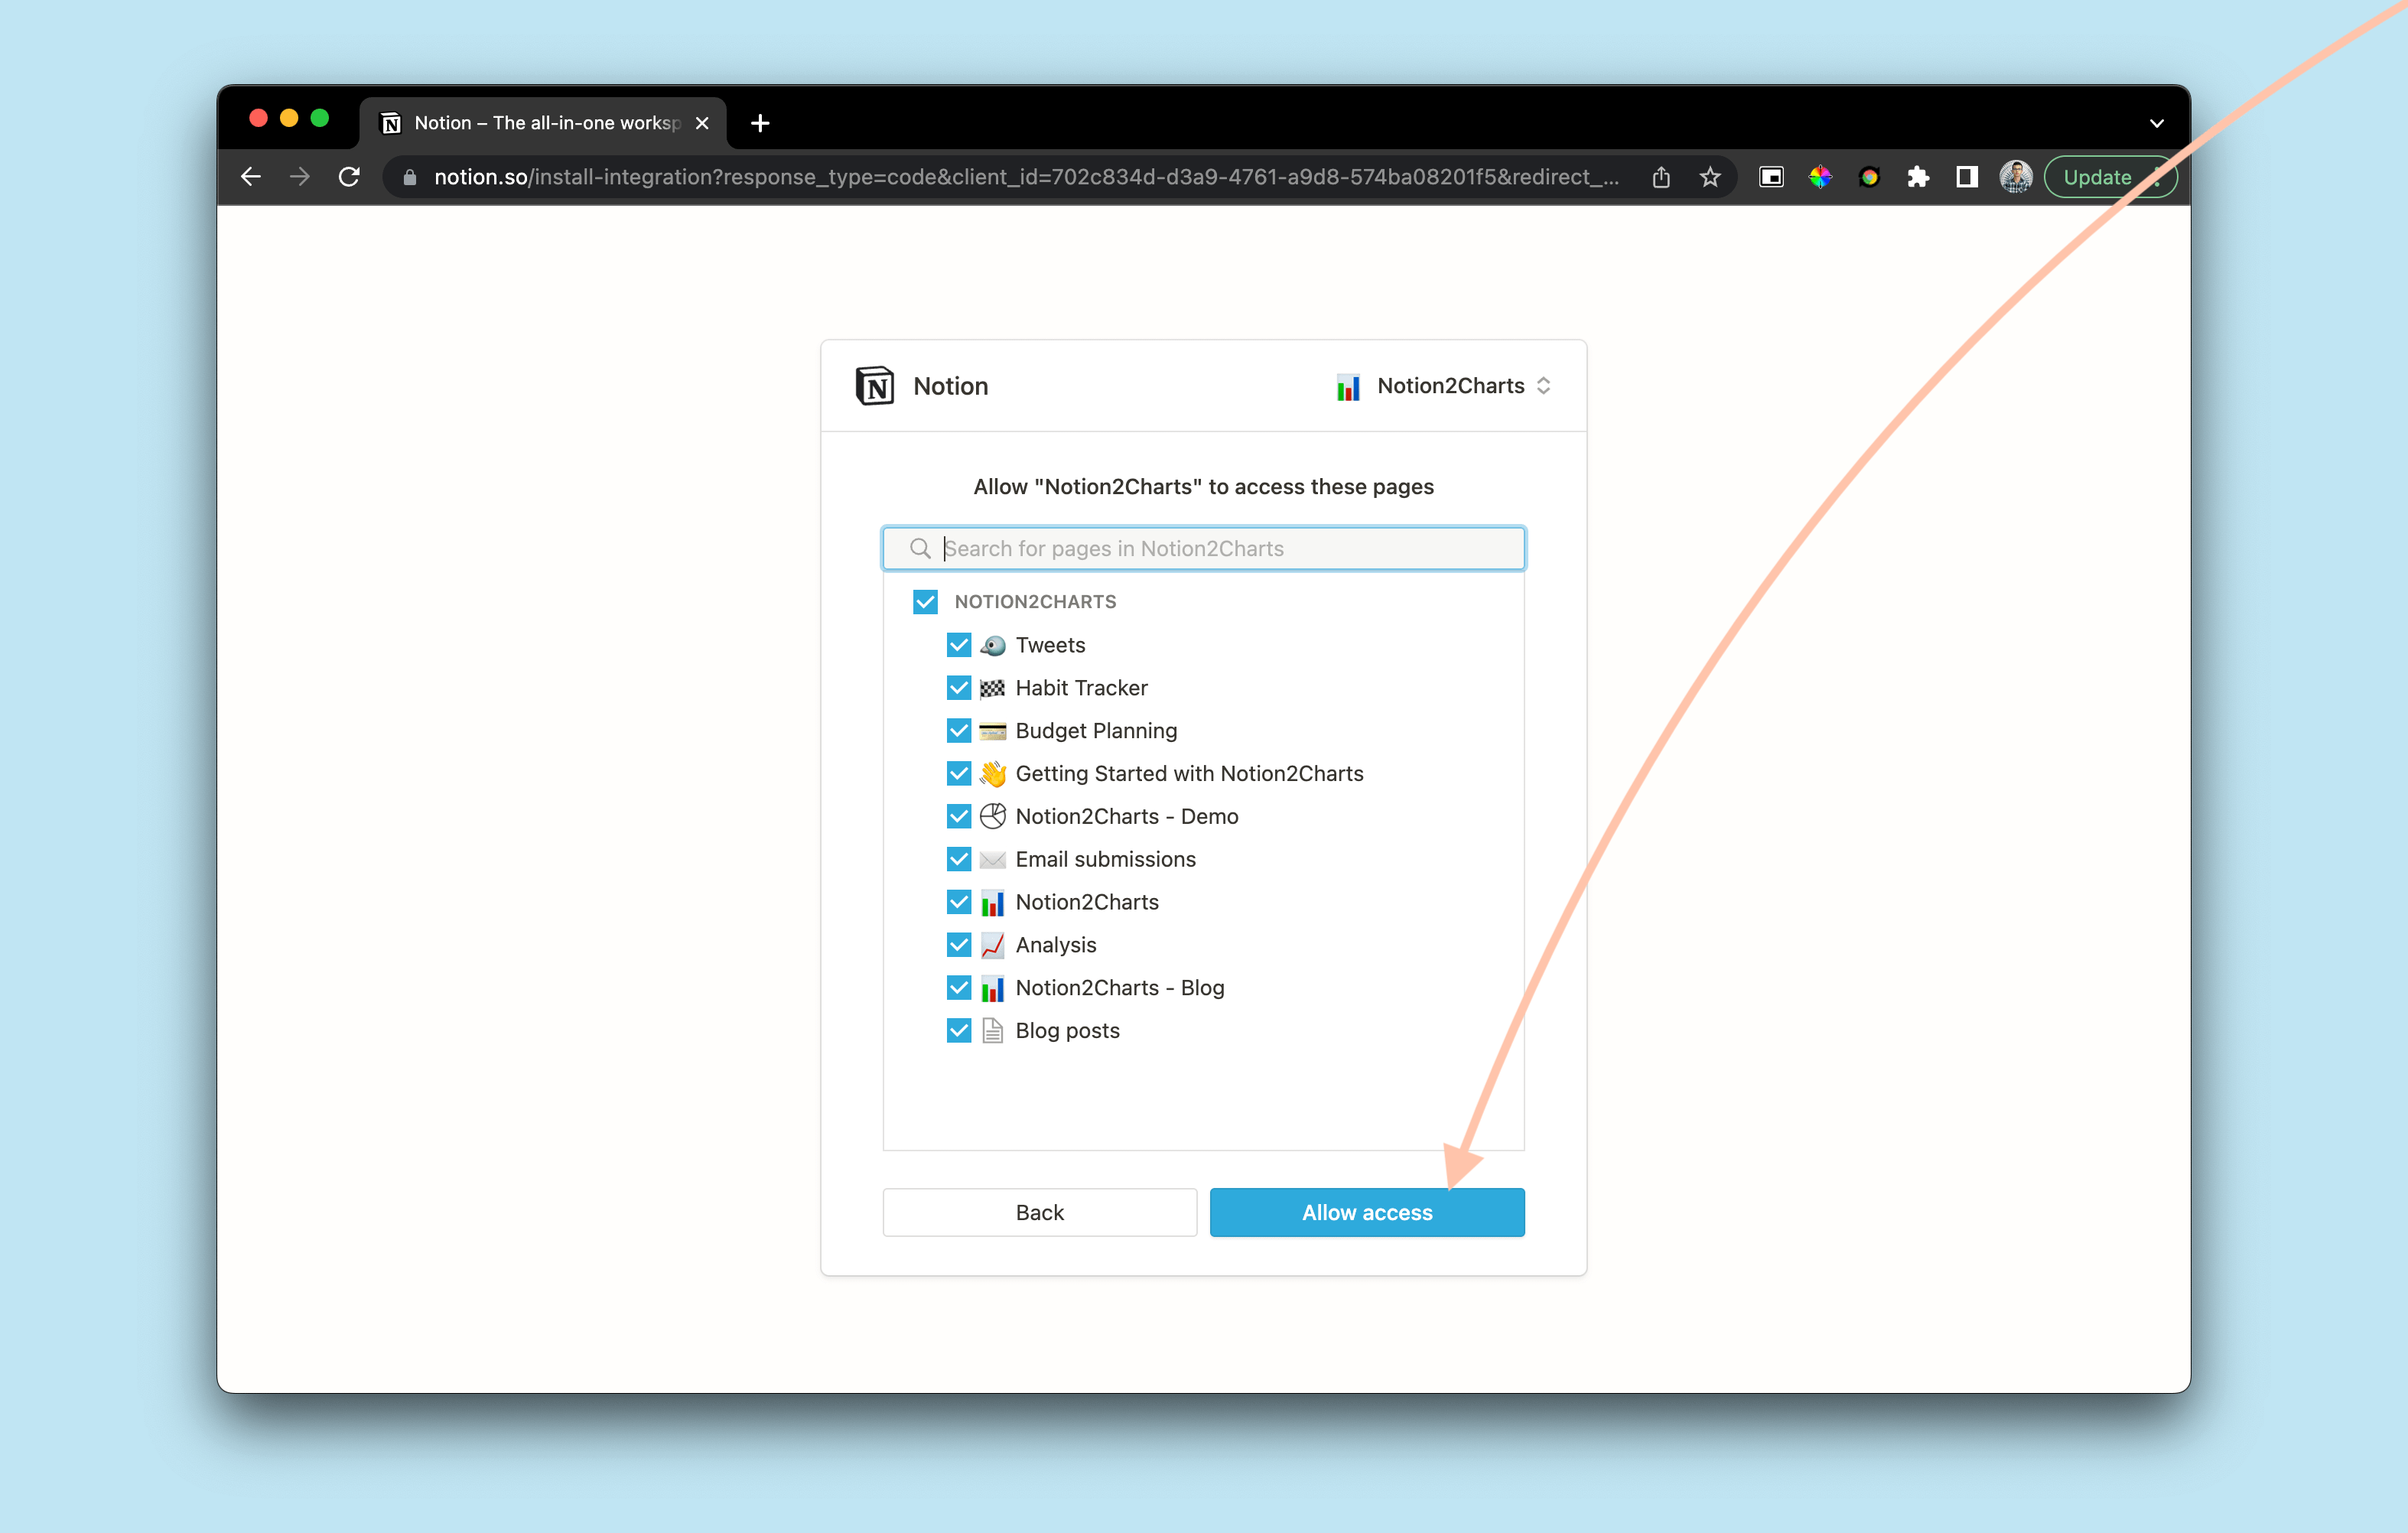
Once you've selected the pages you want to share, click "Allow" to be redirected back to ChartBase.
Step 2: Create a New Chart
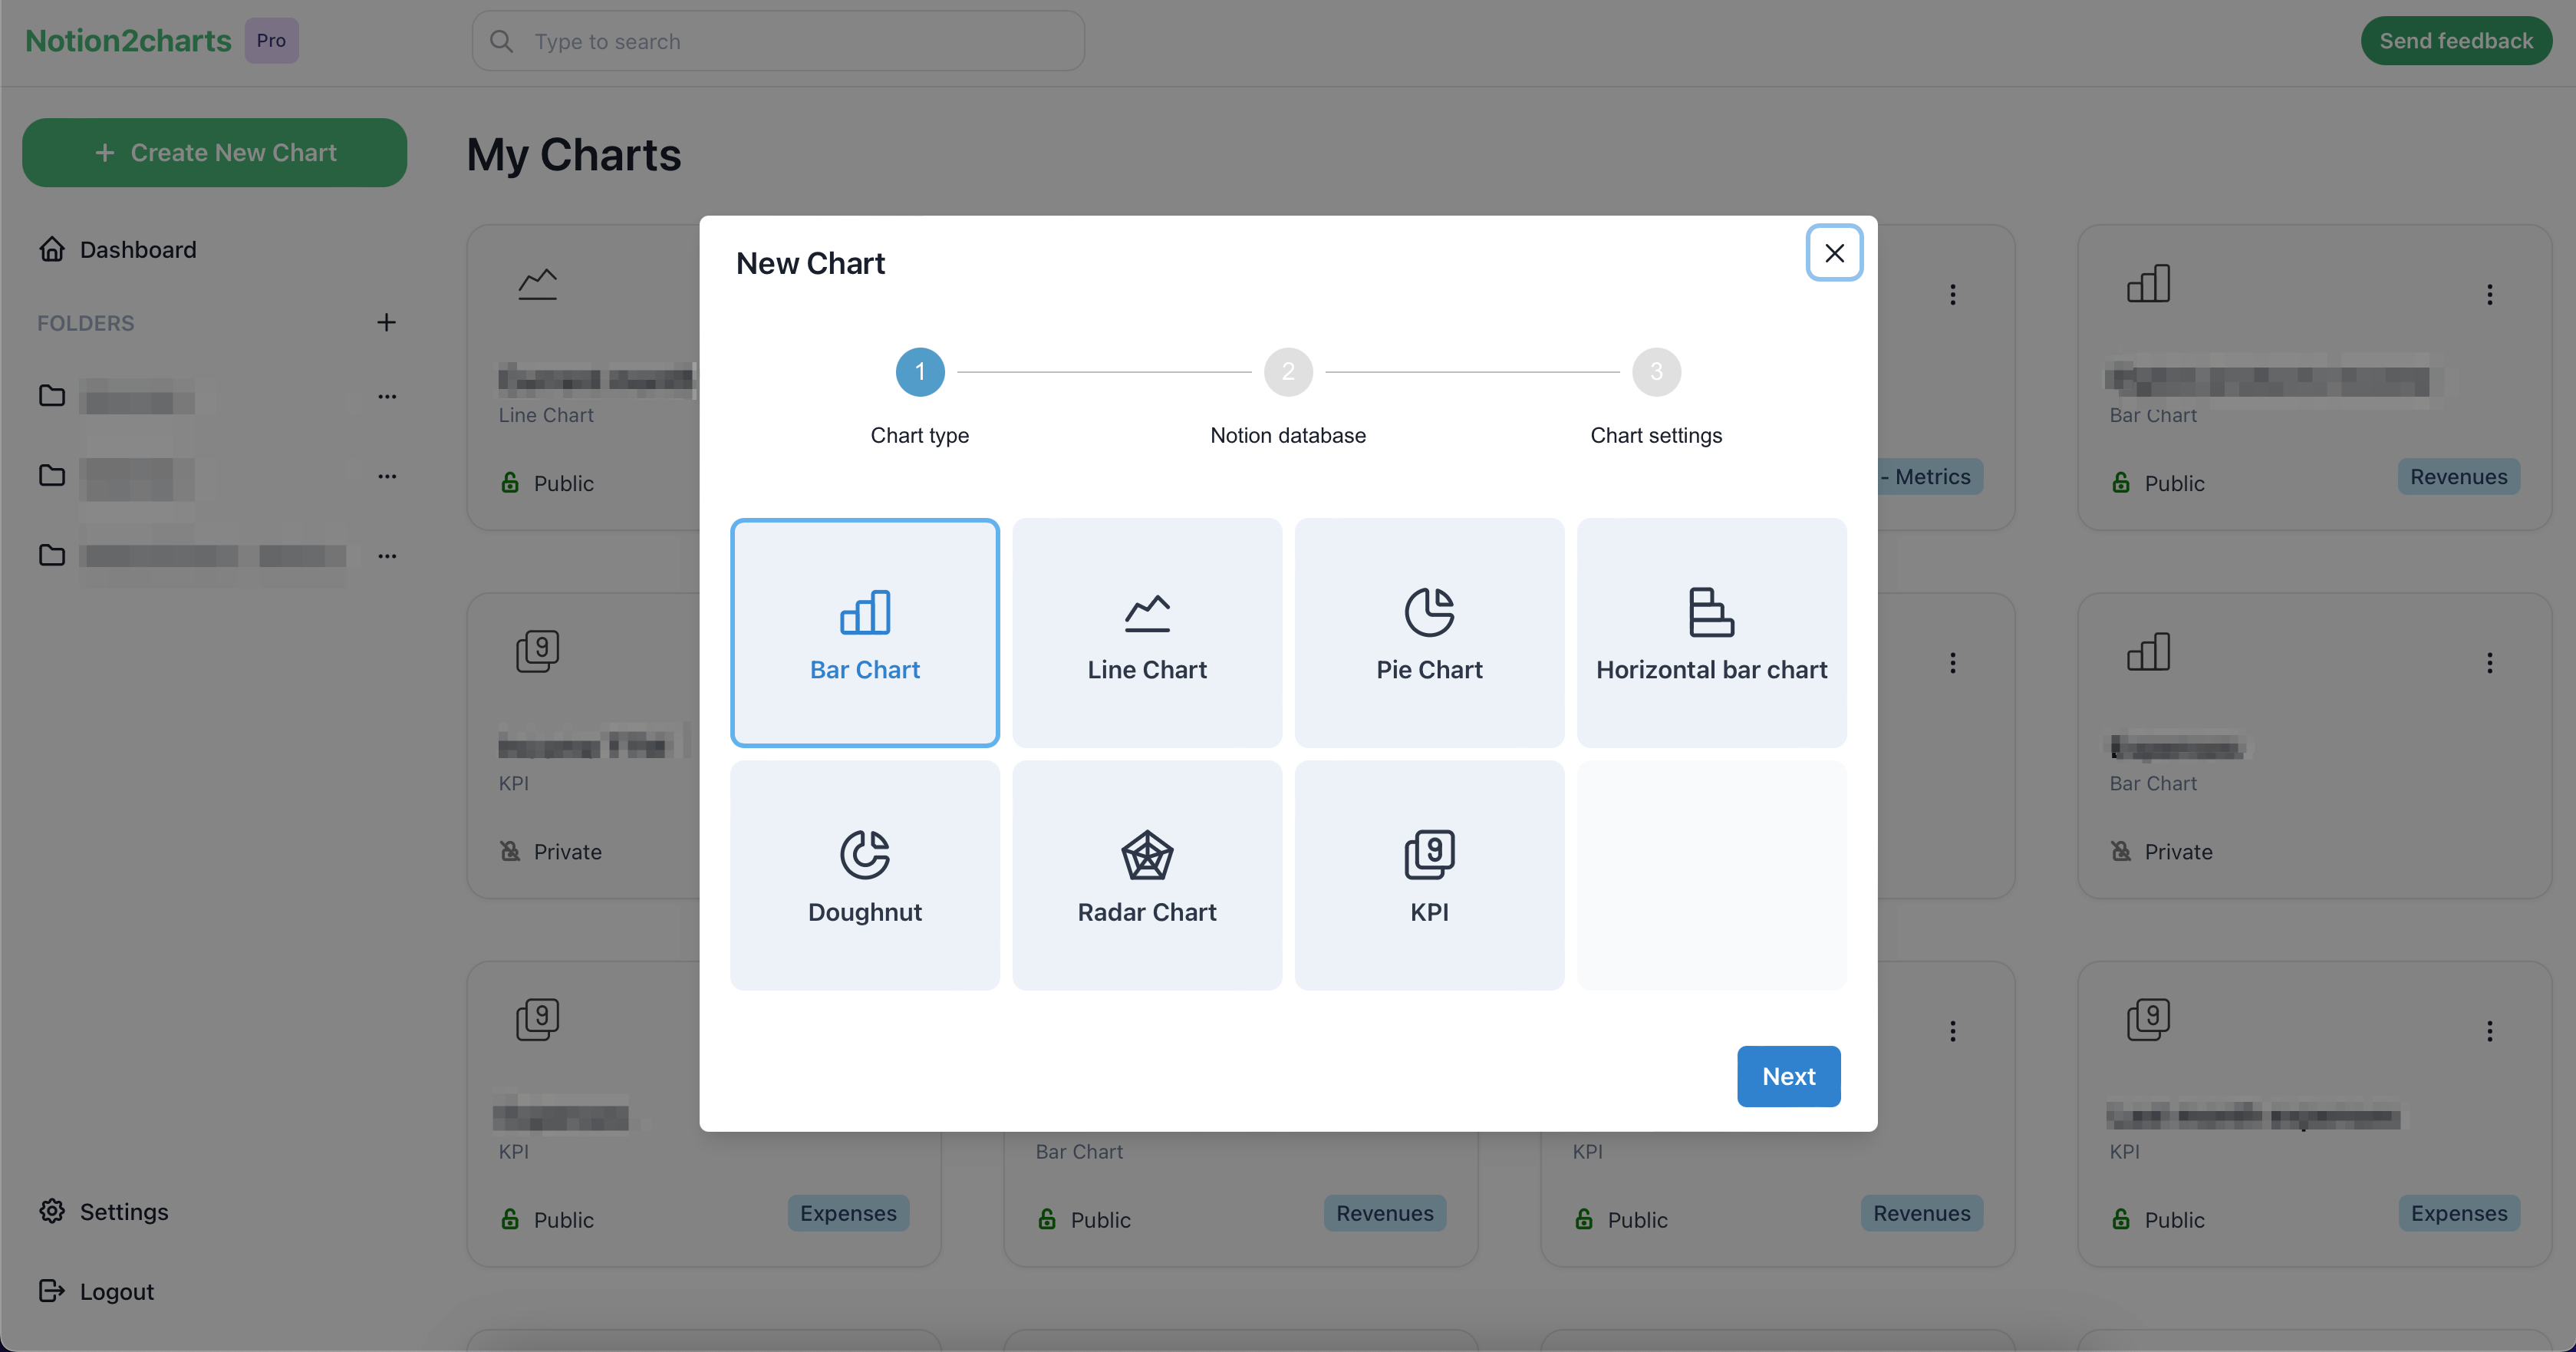
You've successfully connected your Notion workspace to ChartBase. Now you can create a new chart by clicking on the "Plus" button. A modal will pop up asking you to select:
Step 1: The chart type
ChartBase offers a variety of chart types to choose from, including bar, line, pie, horizontal bar, doughnut, radar, and KPI. Choose the chart type that best fits the data you want to visualize.
Step 2: The table you want to graph
Select the Notion table that contains the data you want to use in your chart. You can choose any table that you have shared with ChartBase in Step 1
Step 3: The chart settings
In this step, you can customize the chart by selecting the label, x-axis, and y-axis values and adding any filters or sort options. You can also choose the colors and style of the chart, and add a title and description.
Once you've customized the chart to your liking, click the "Create chart" button to create the chart.
Step 3: Embed the Chart in Your Notion Page
Now that you've created a chart in ChartBase, you can embed it in a Notion page by following these steps:
- In ChartBase, click on the "Copy URL" button in the top right corner of the chart builder.
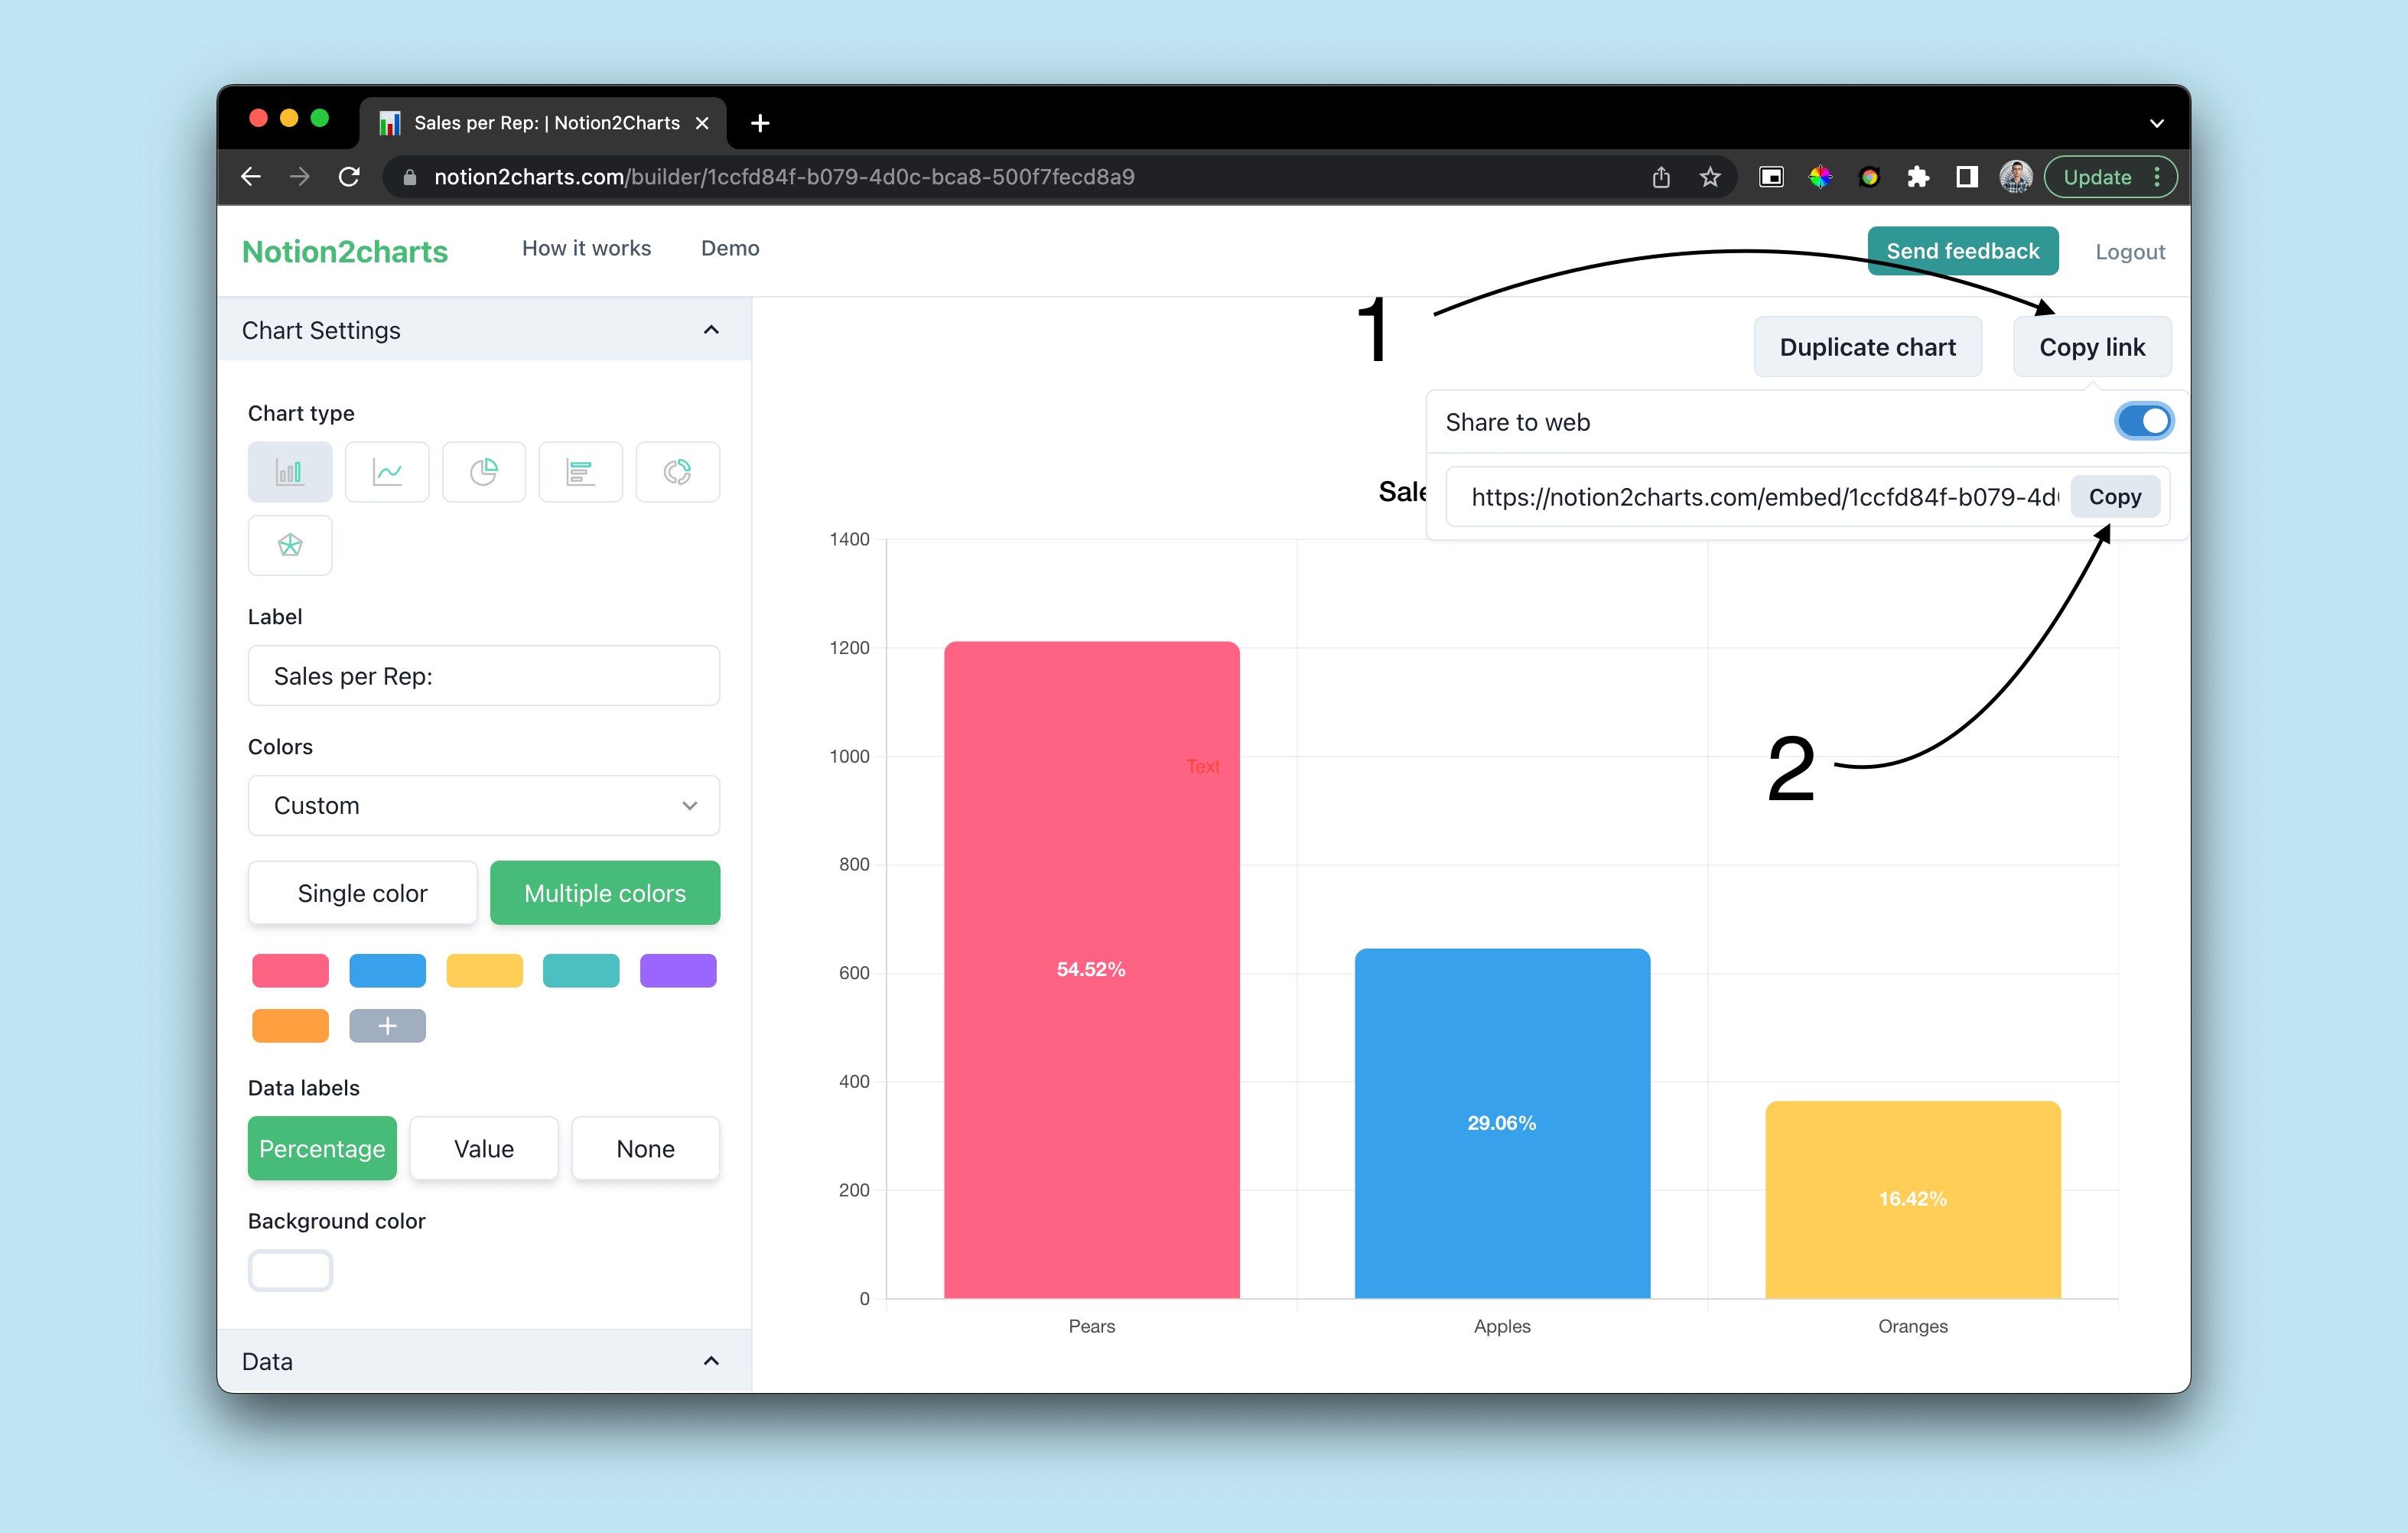
- Enable public sharing by clicking on the toggle next to "Public Sharing" in the chart builder.
- In your Notion page, click on the "Embed" button in the toolbar and paste the URL of the chart you just created.
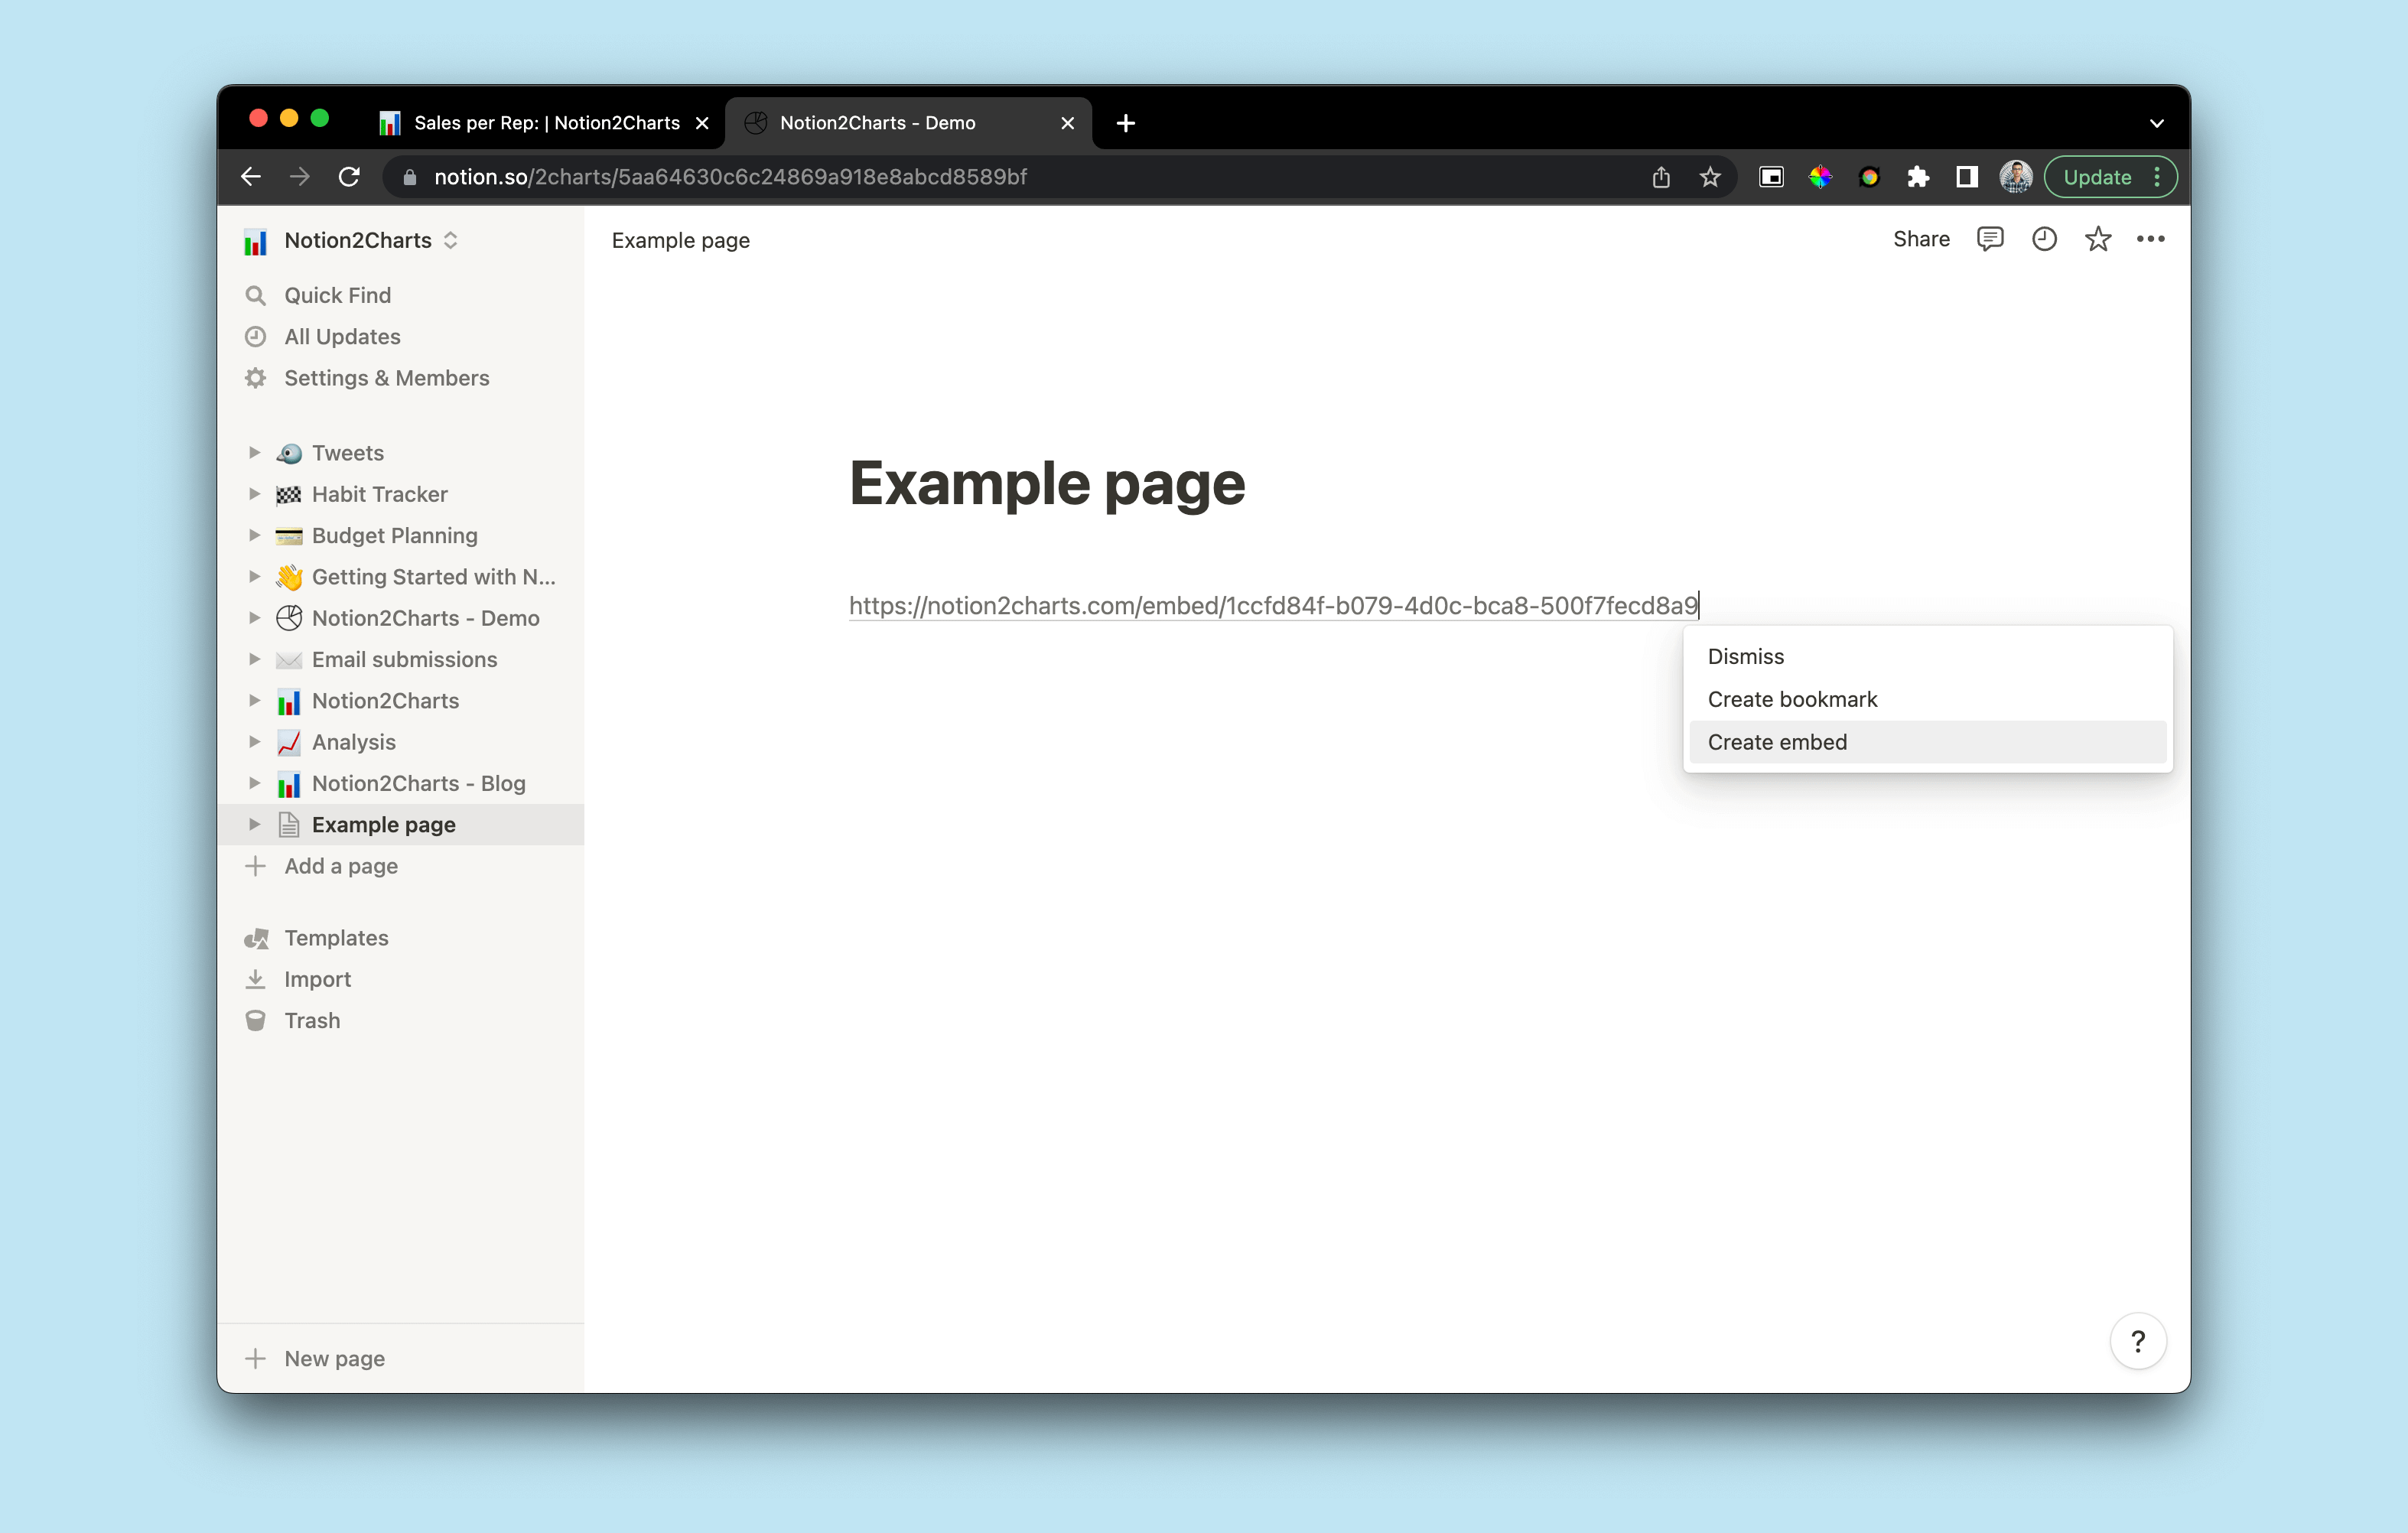
- Click "Embed" to add the chart to your page.
Tips and Best Practices
Here are some tips and best practices for using charts in Notion:
-
Make sure that your data is organized and structured in a way that is easy to visualize. Consider using columns and properties that are appropriate for the type of chart you want to create.
-
Use filters and sort options to refine and customize the data displayed in the chart. For example, you can use a date filter to show data from a specific time period or a status filter to show only certain types of data.
-
Customize the appearance of the chart to make it visually appealing and easy to understand. Choose colors that are easy to differentiate and consider using a style that matches the design of your Notion page.
-
Use charts to track progress and analyze trends over time. For example, you can create a line chart to show how your sales or productivity have changed over the past month or year.
-
Keep in mind that ChartBase has some limitations, such as the maximum number of data points that can be displayed in a chart. If you encounter any issues or have questions, you can contact the ChartBase support team for assistance.
I hope this step-by-step guide has been helpful and that you are now able to create and customize beautiful charts from your Notion data using ChartBase
Latest Posts
Notion Charts: 7 Ways to Make Graphs in Notion
We share the best ways to turn databses into Charts - from ChartBase to LucidChart to GRID, we cover it all.
How to build a website with Notion for free without coding
Whether you wanna build that portfolio website or a blog, there are a lot of ways to do it. But the most common way is to use a free online service called Popsy...