How to create graphs from your Notion tables without coding
March 31, 2022 — 3 min readgraphsnotiondatabase
Why graphs in Notion?
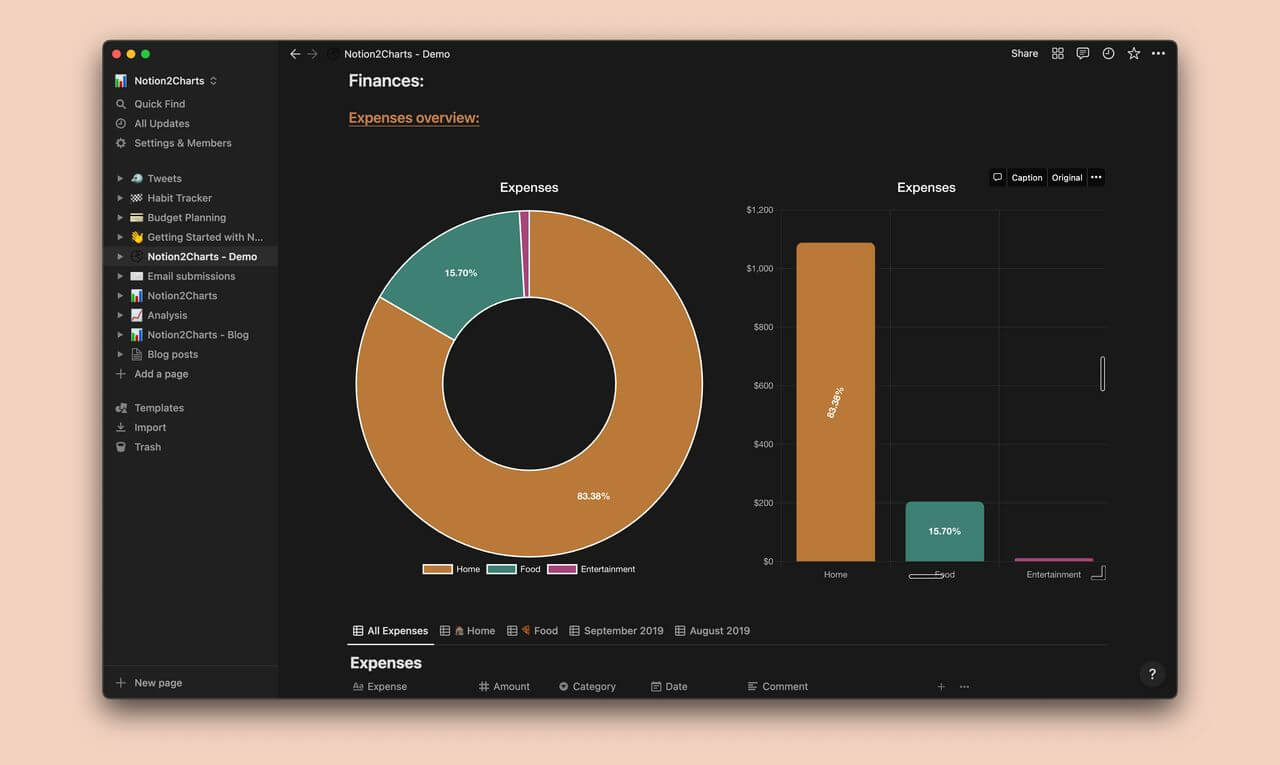
Graphs are a great way to visualize data. They enable you to visualize data in a way that is easy to understand and to share with others but so far they are still not available in Notion.
What are the use cases?
Having charts in Notion unlocks many possibilities for you. You can analyze your spending behavior by turning that expenses tracker into a chart. You can also use it to visualize productivity, finances, sales, or any other data you already have in Notion.
What is ChartBase 📊?
ChartBase is a tool that allows you to create graphs from your Notion tables without coding. You simply select the table you want to graph, and the tool will create a graph for you. It also allows you to customize the graph by adding custom, colors, filter and sort and many other features.
Now to get started:
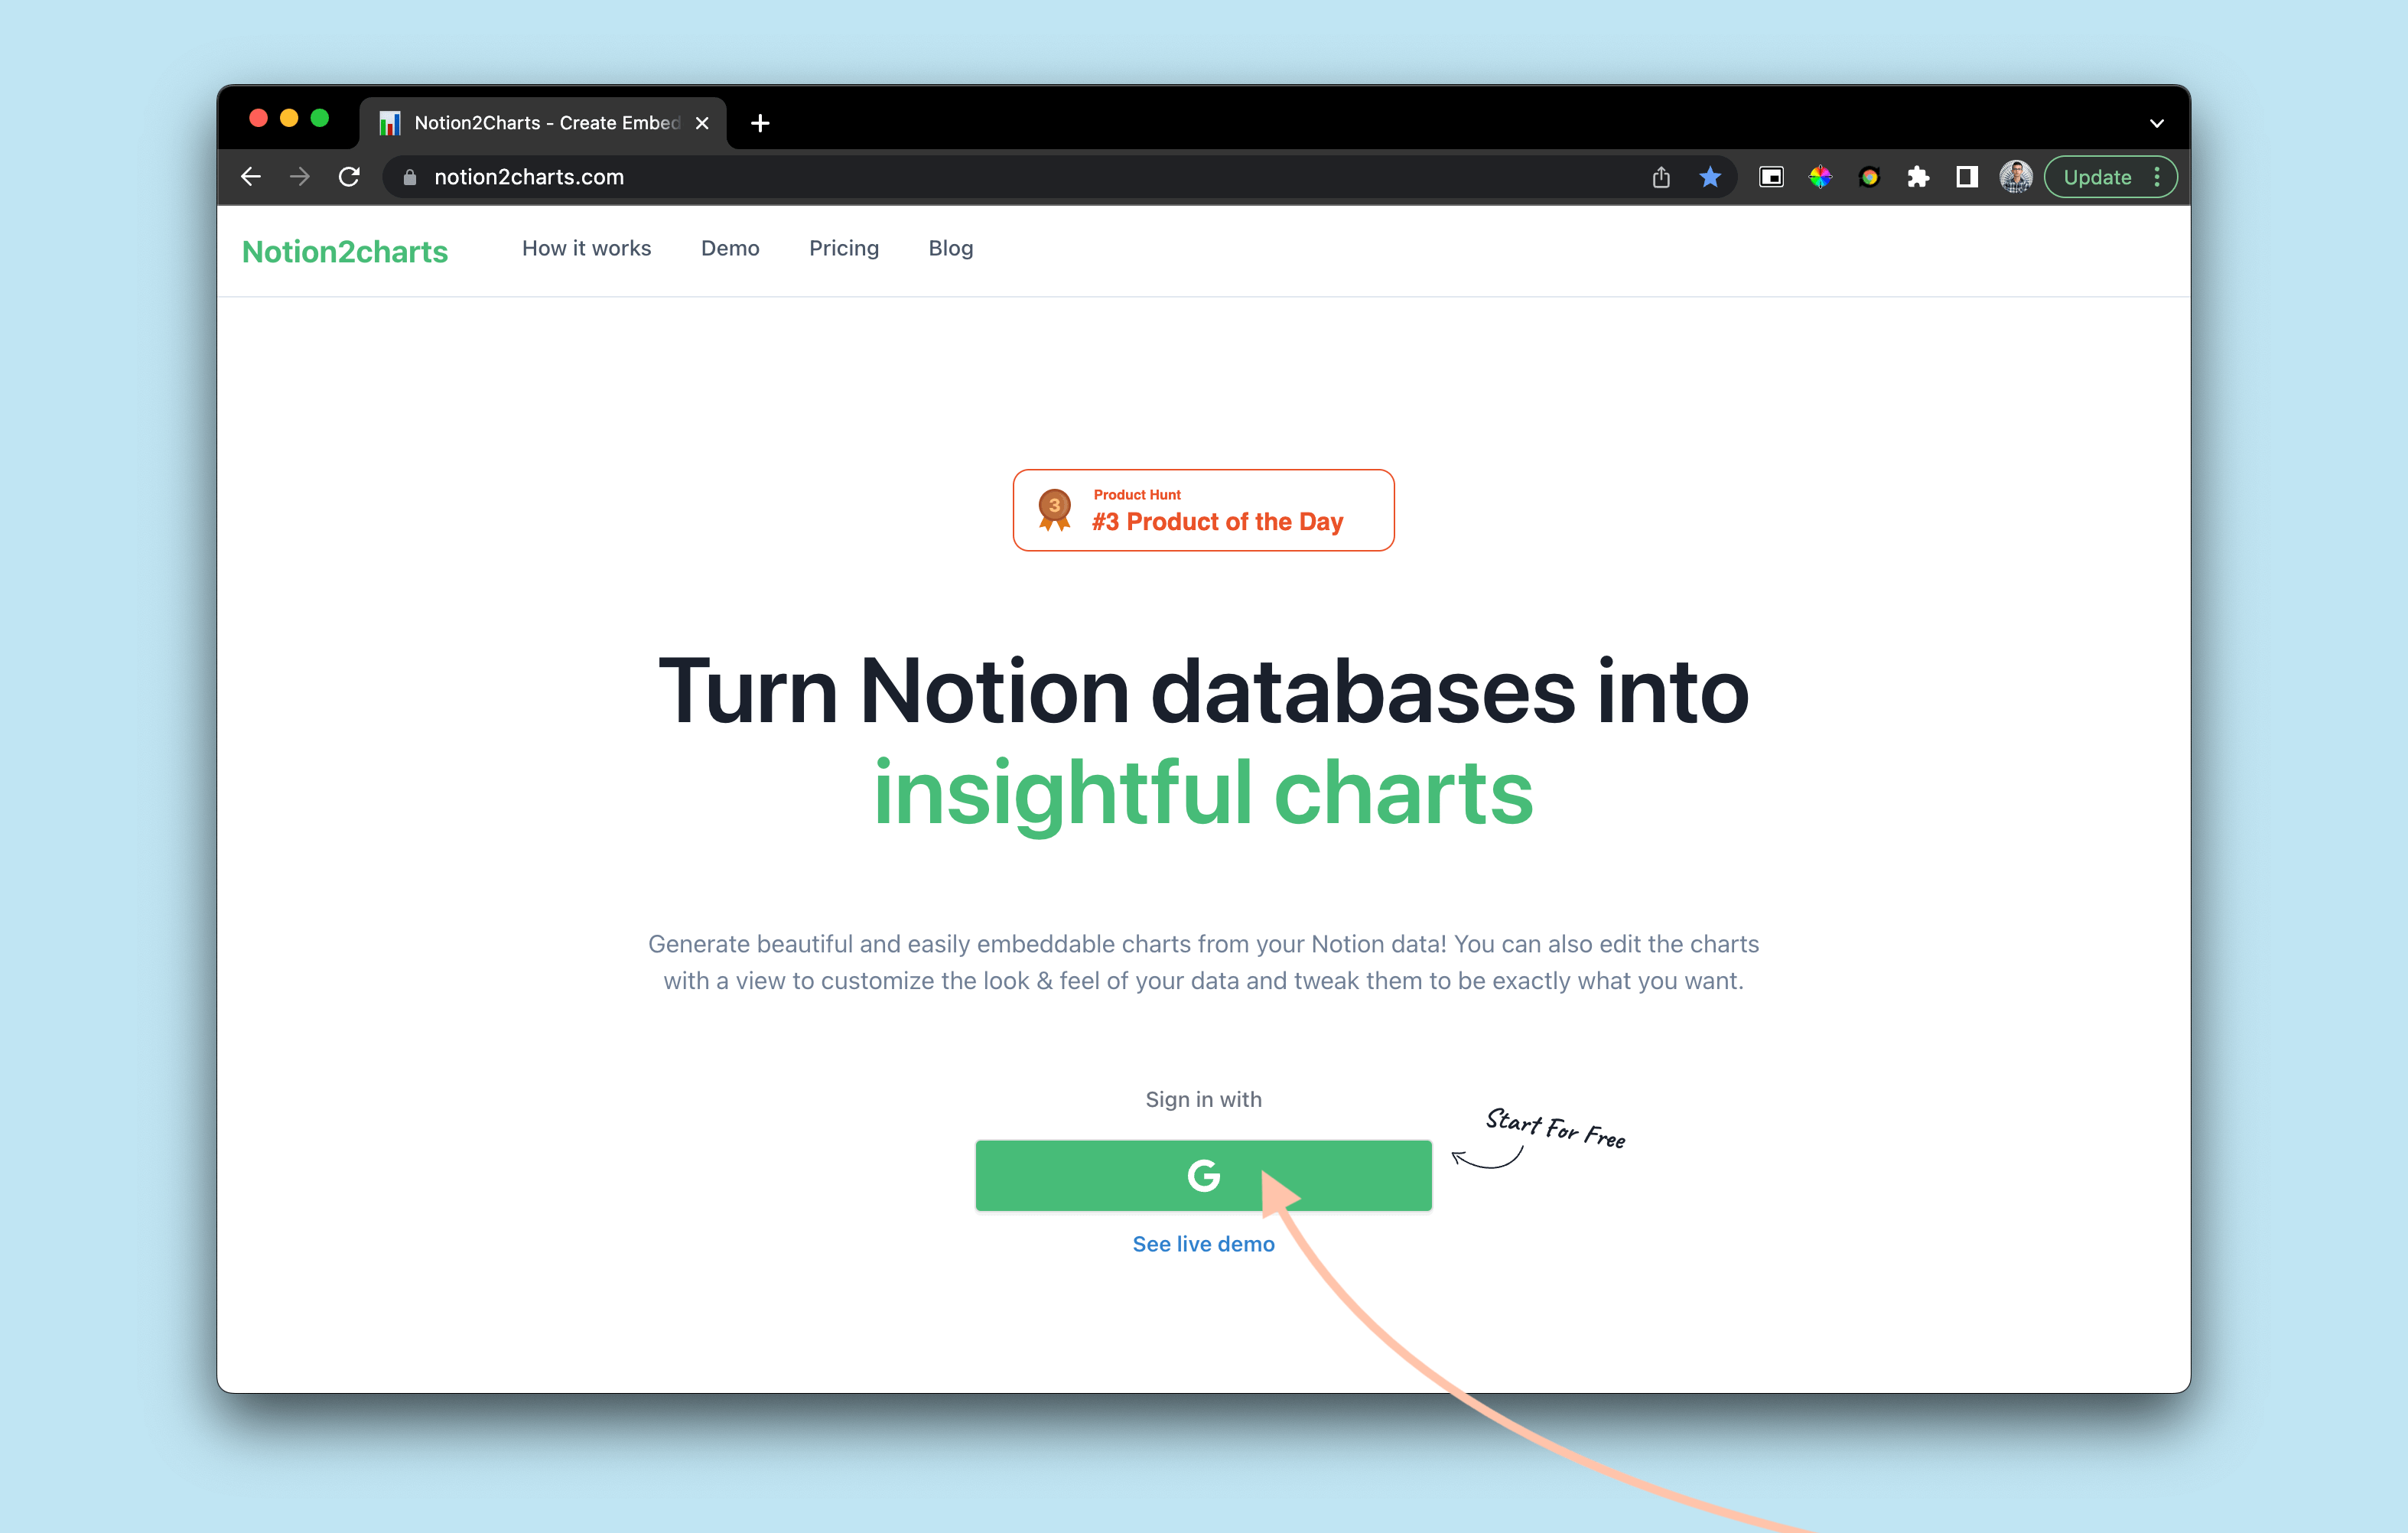
1. Setup your account
To get started, you need to create an account on ChartBase by clicking on the Sign in button. You'll then be redirected to the home page after successfully signing in.
Once you're signed in, you will see a button that says "Connect to Notion". Click on this button to connect your Notion workspace to ChartBase.
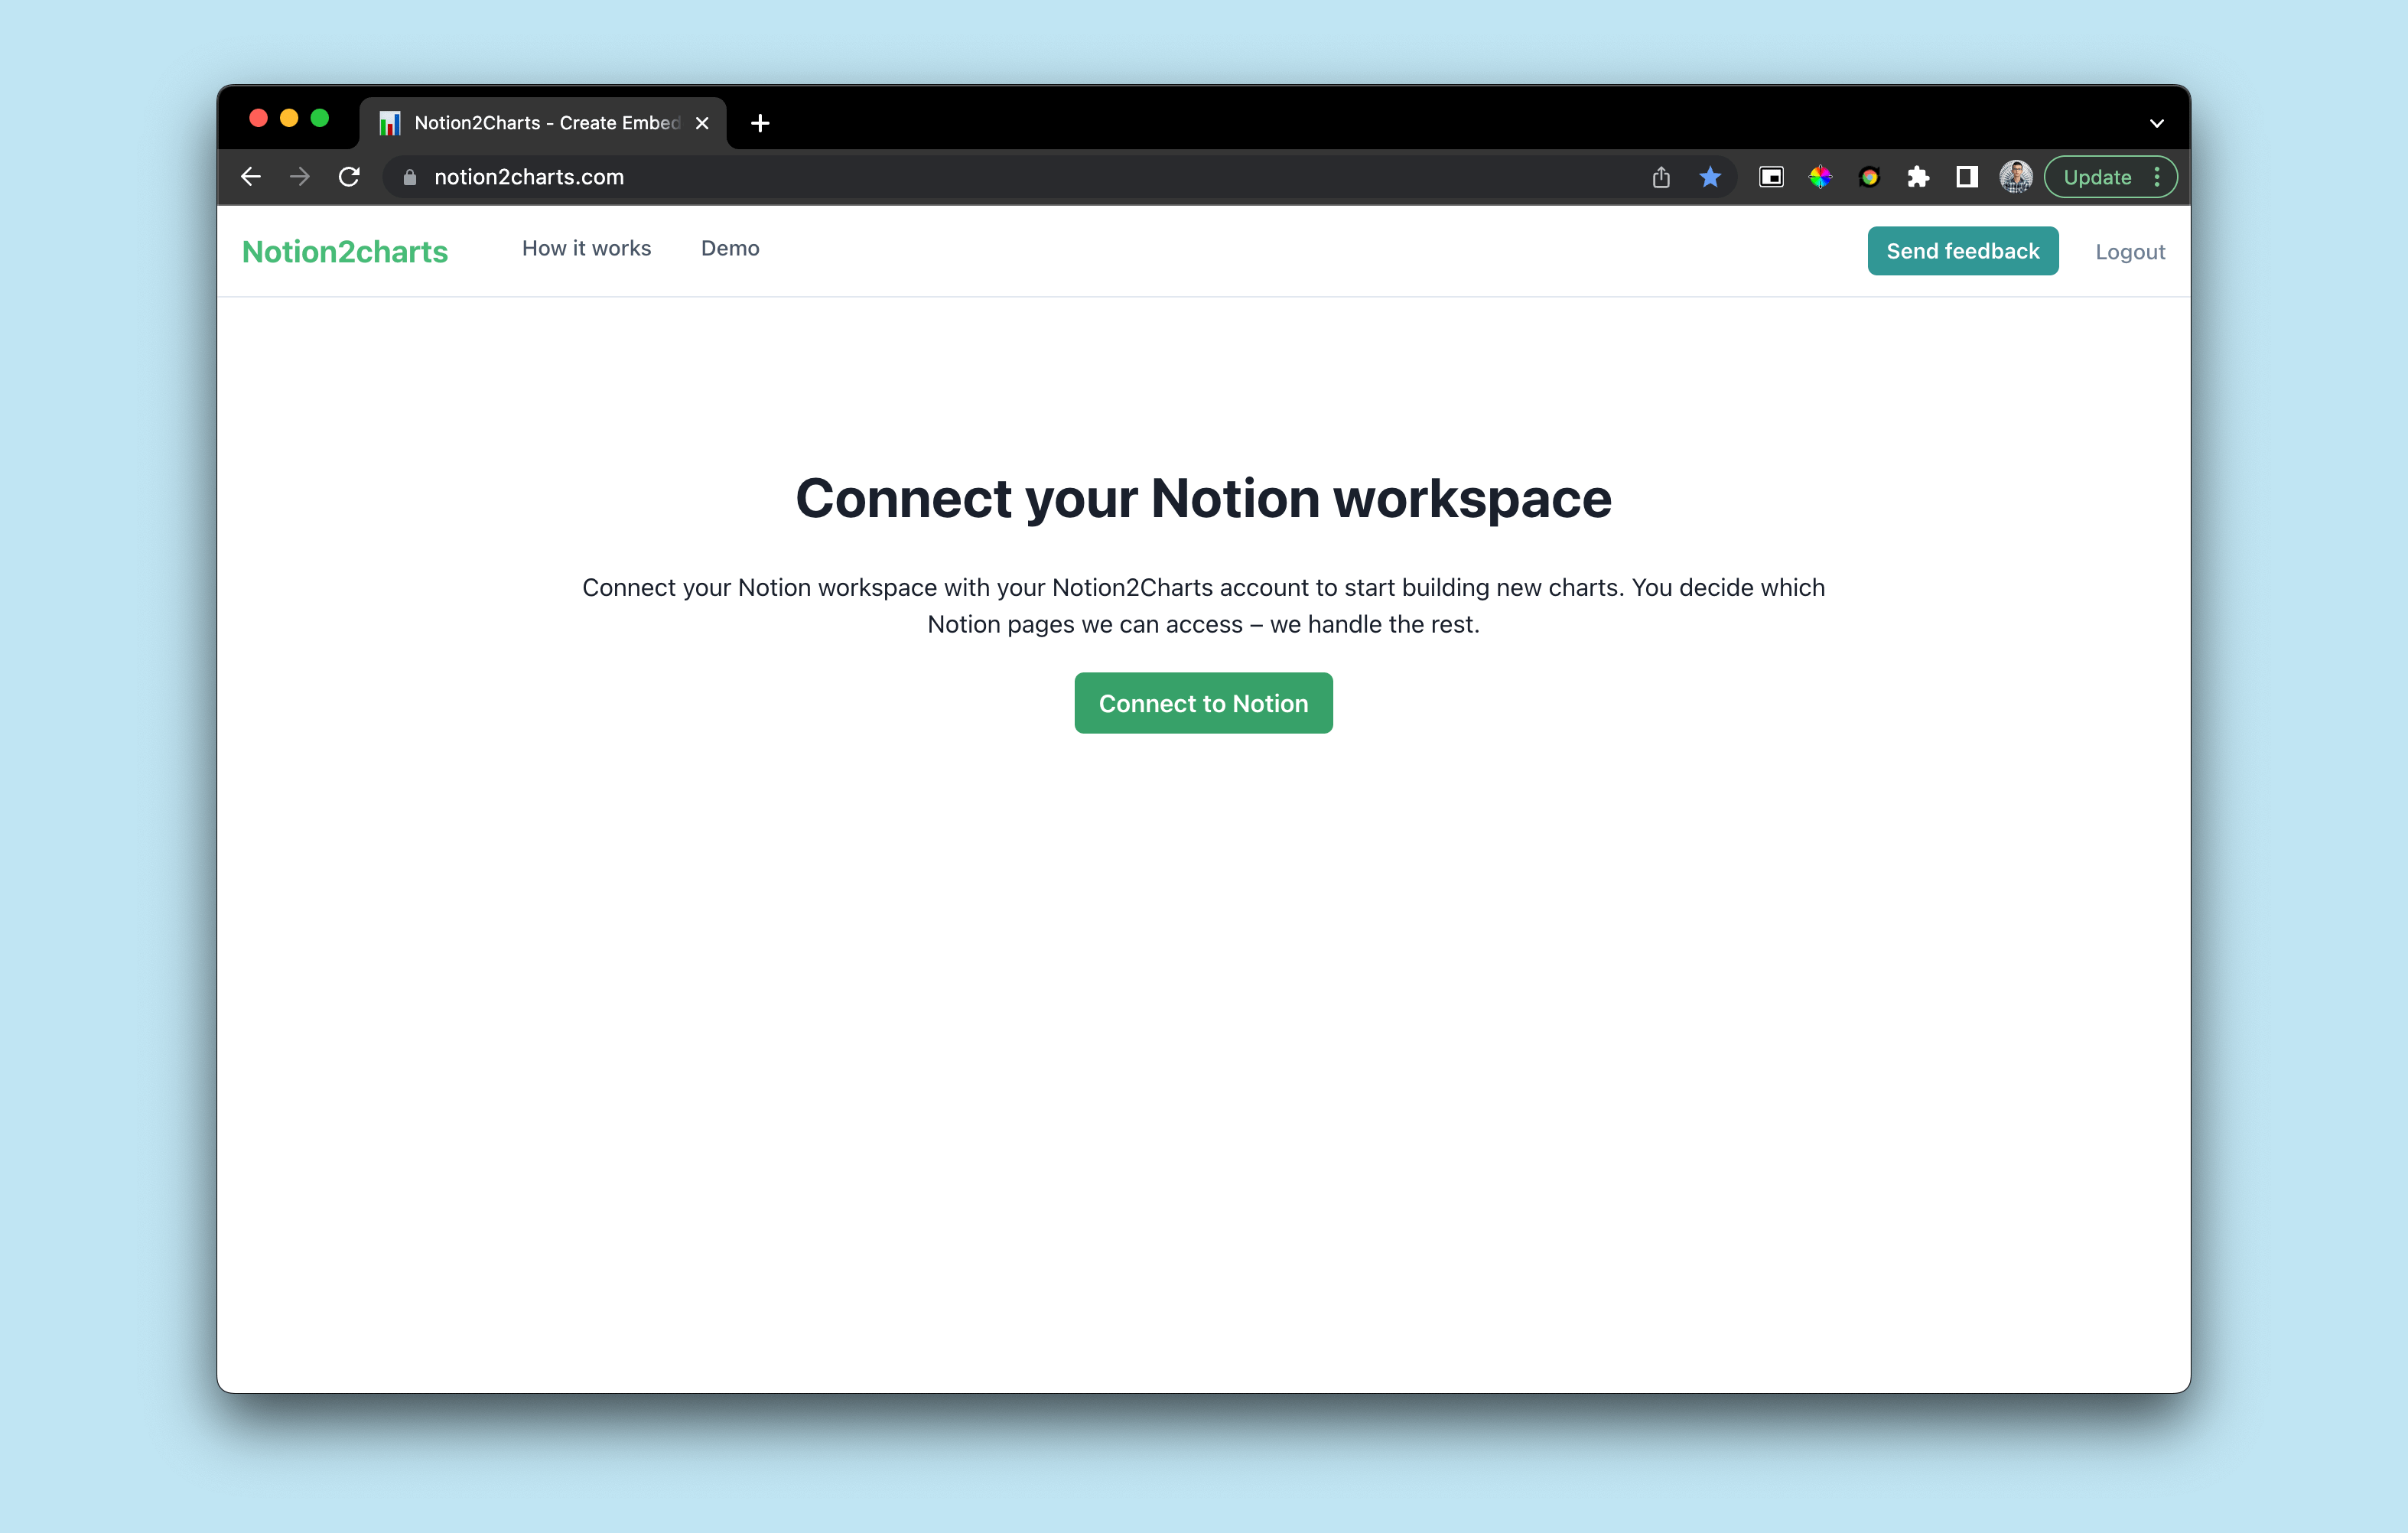
💡 In this step, you'll be asked to select the Notion pages you'd like to share with ChartBase so it's important to select the pages you want to share or select all of them.
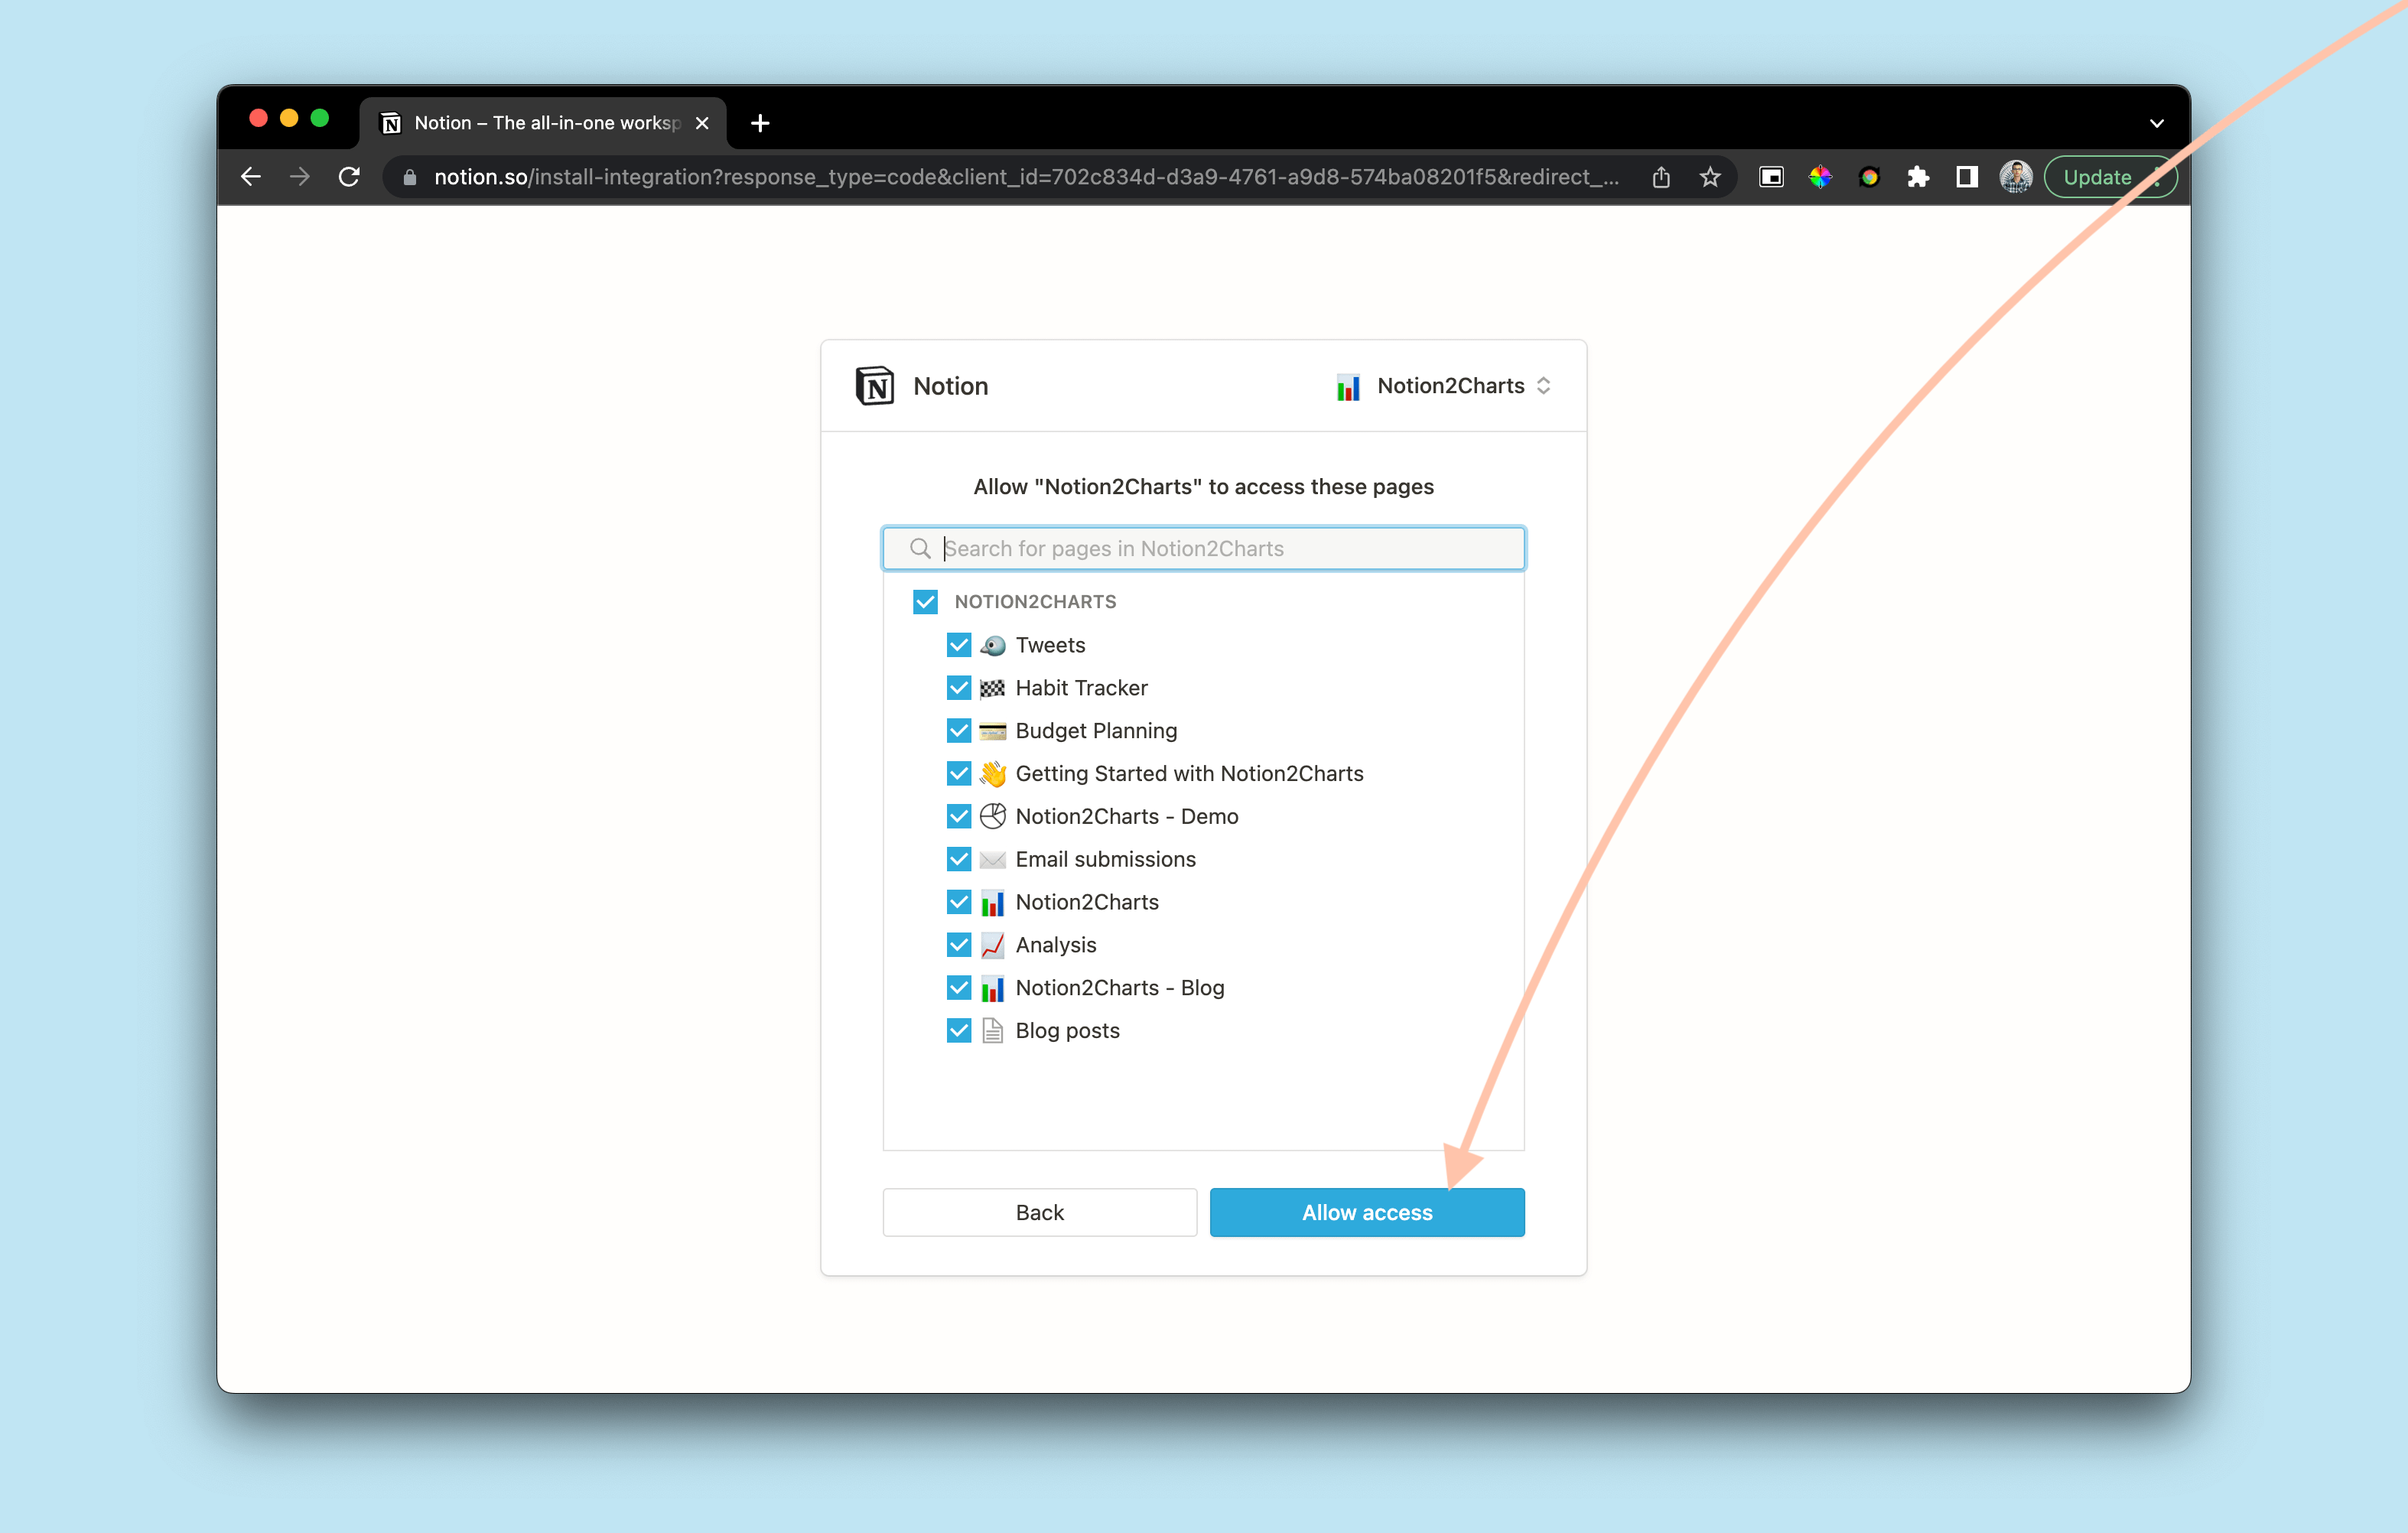
Once you've selected the pages you want to share, click allow to be redirected back to ChartBase.
2. Create a new chart in ChartBase
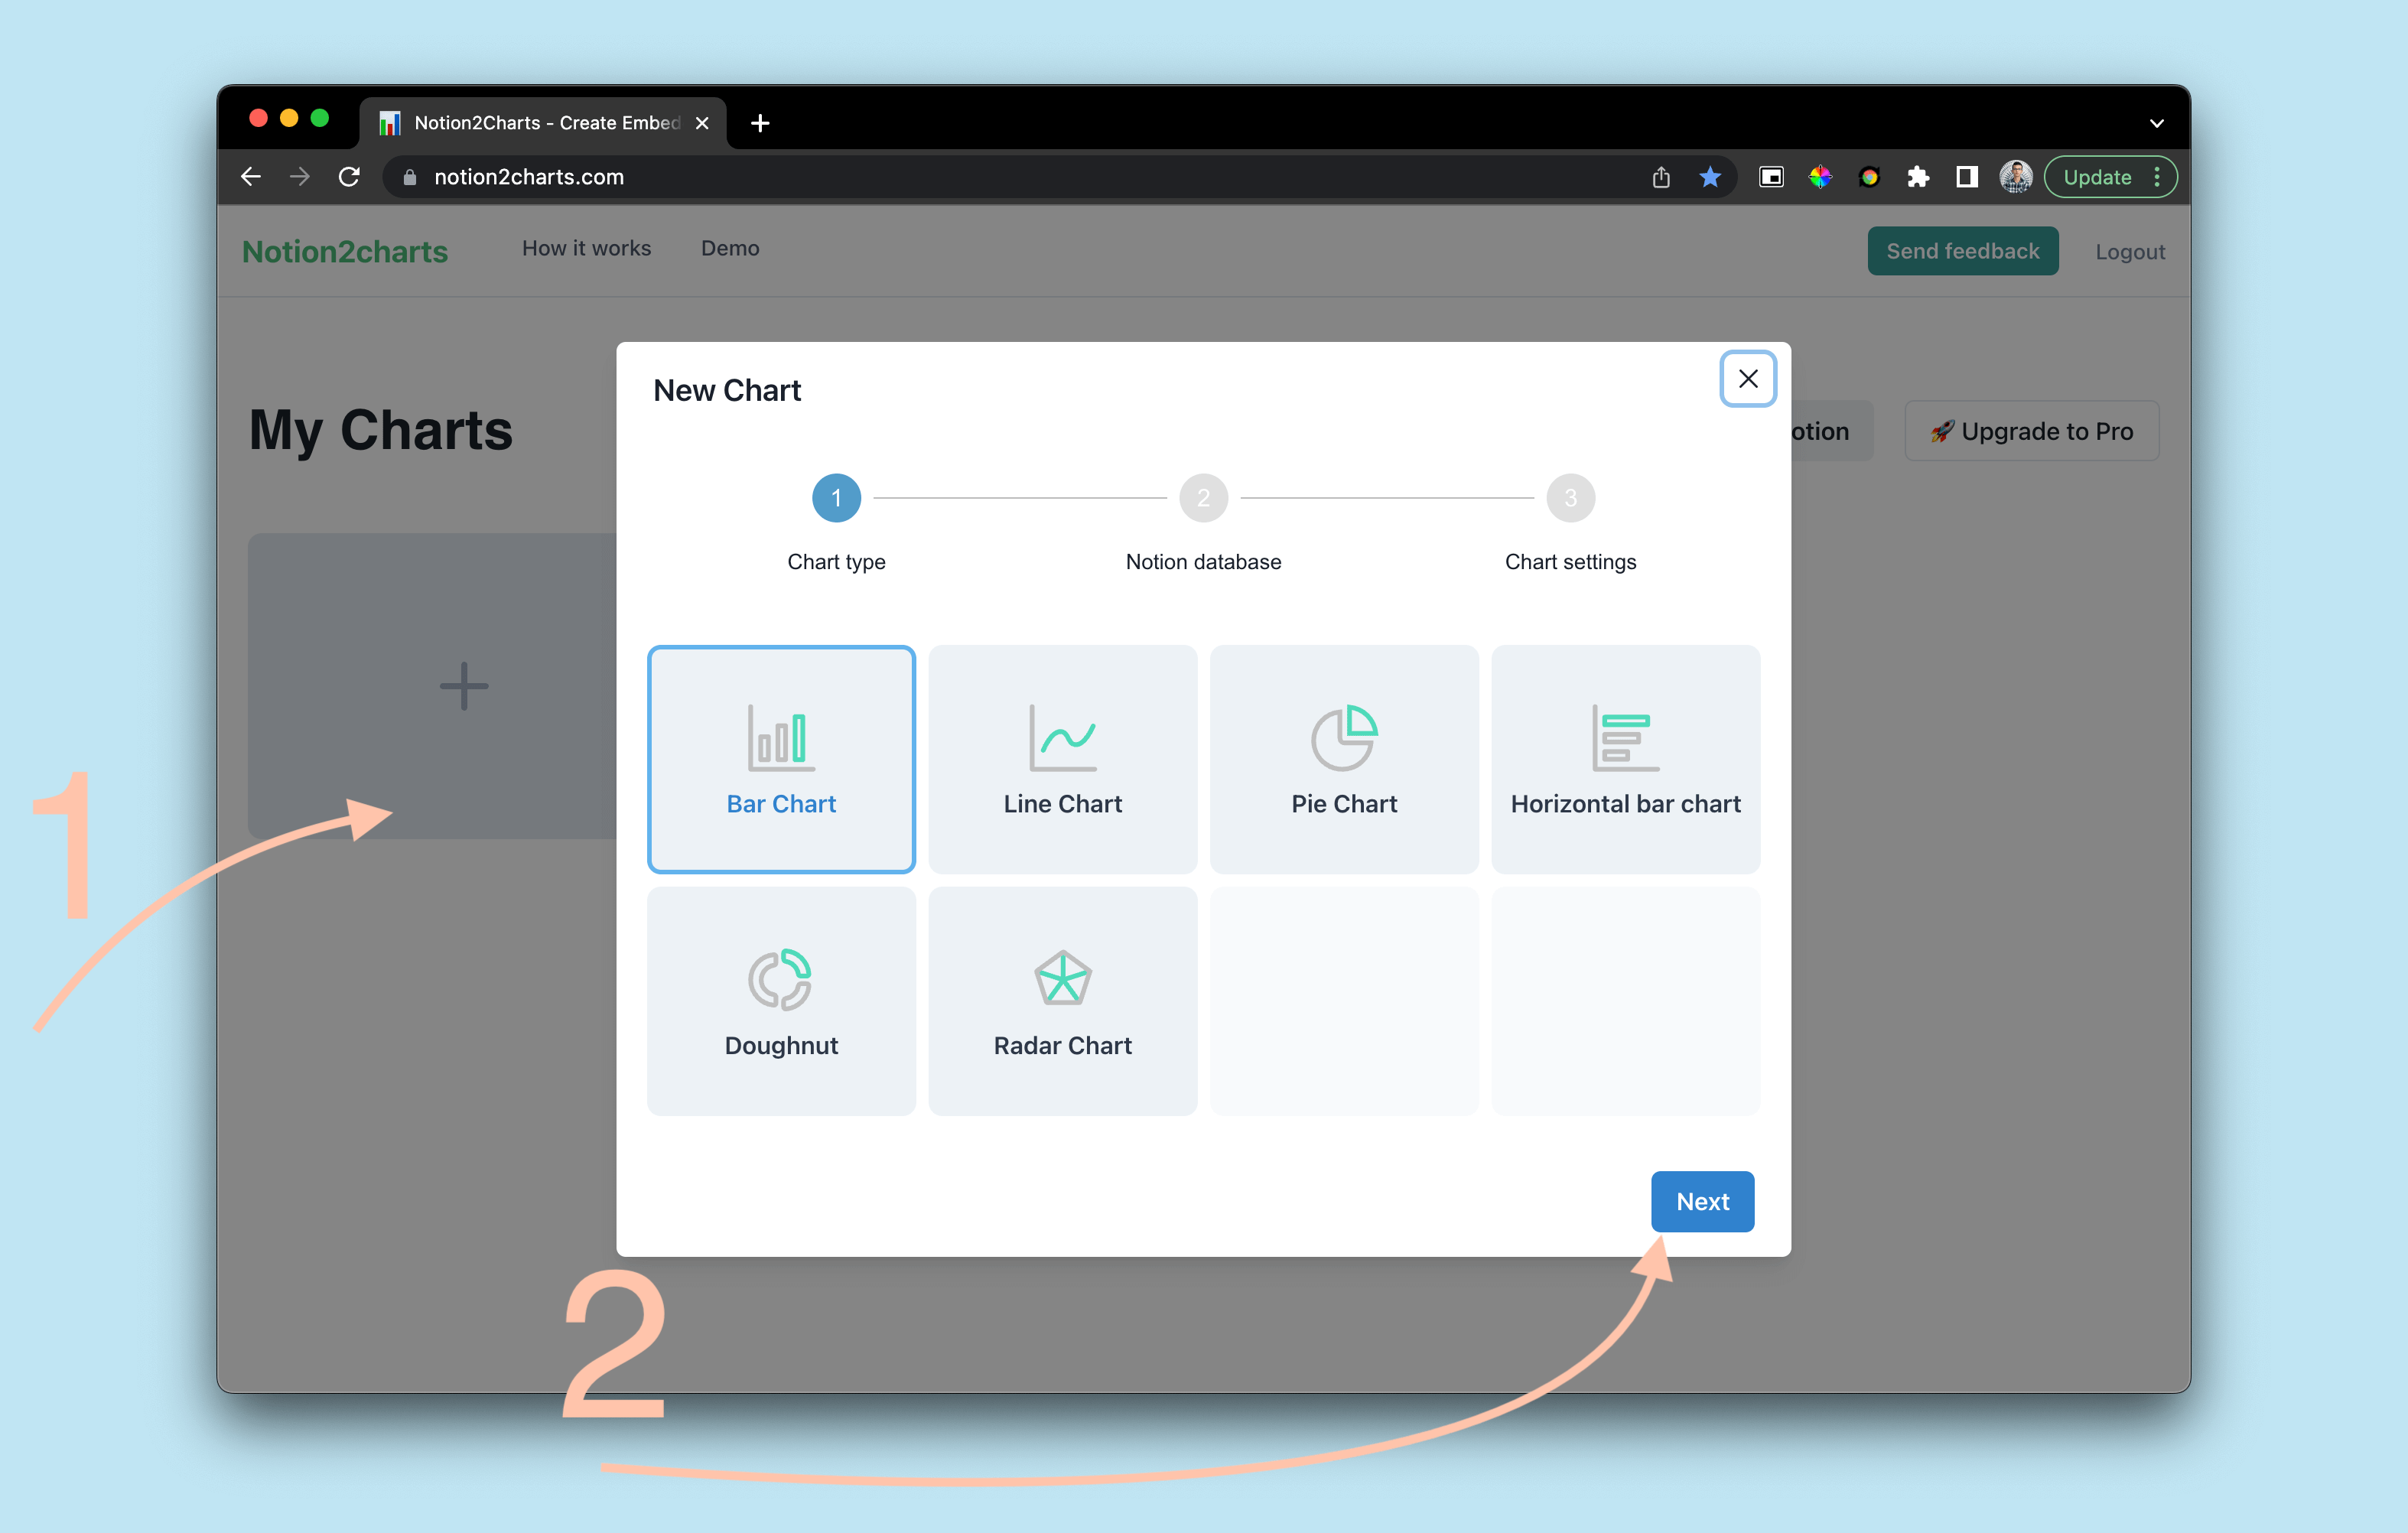
You've successfully connected your Notion workspace to ChartBase. Now you can create a new chart in ChartBase by clicking on the "Plus" button. A modal will pop up asking you to select:
Step 1 : The chart type
Step 2 : The table you want to graph
Step 3 : The chart settings (label, xAxis, yAxis, etc.)
Once you went through all the steps, you should be able to click the "Create chart" button.
Congratulations! 🎊 You've successfully created a new chart in ChartBase.
3. Embed the chart in your Notion page
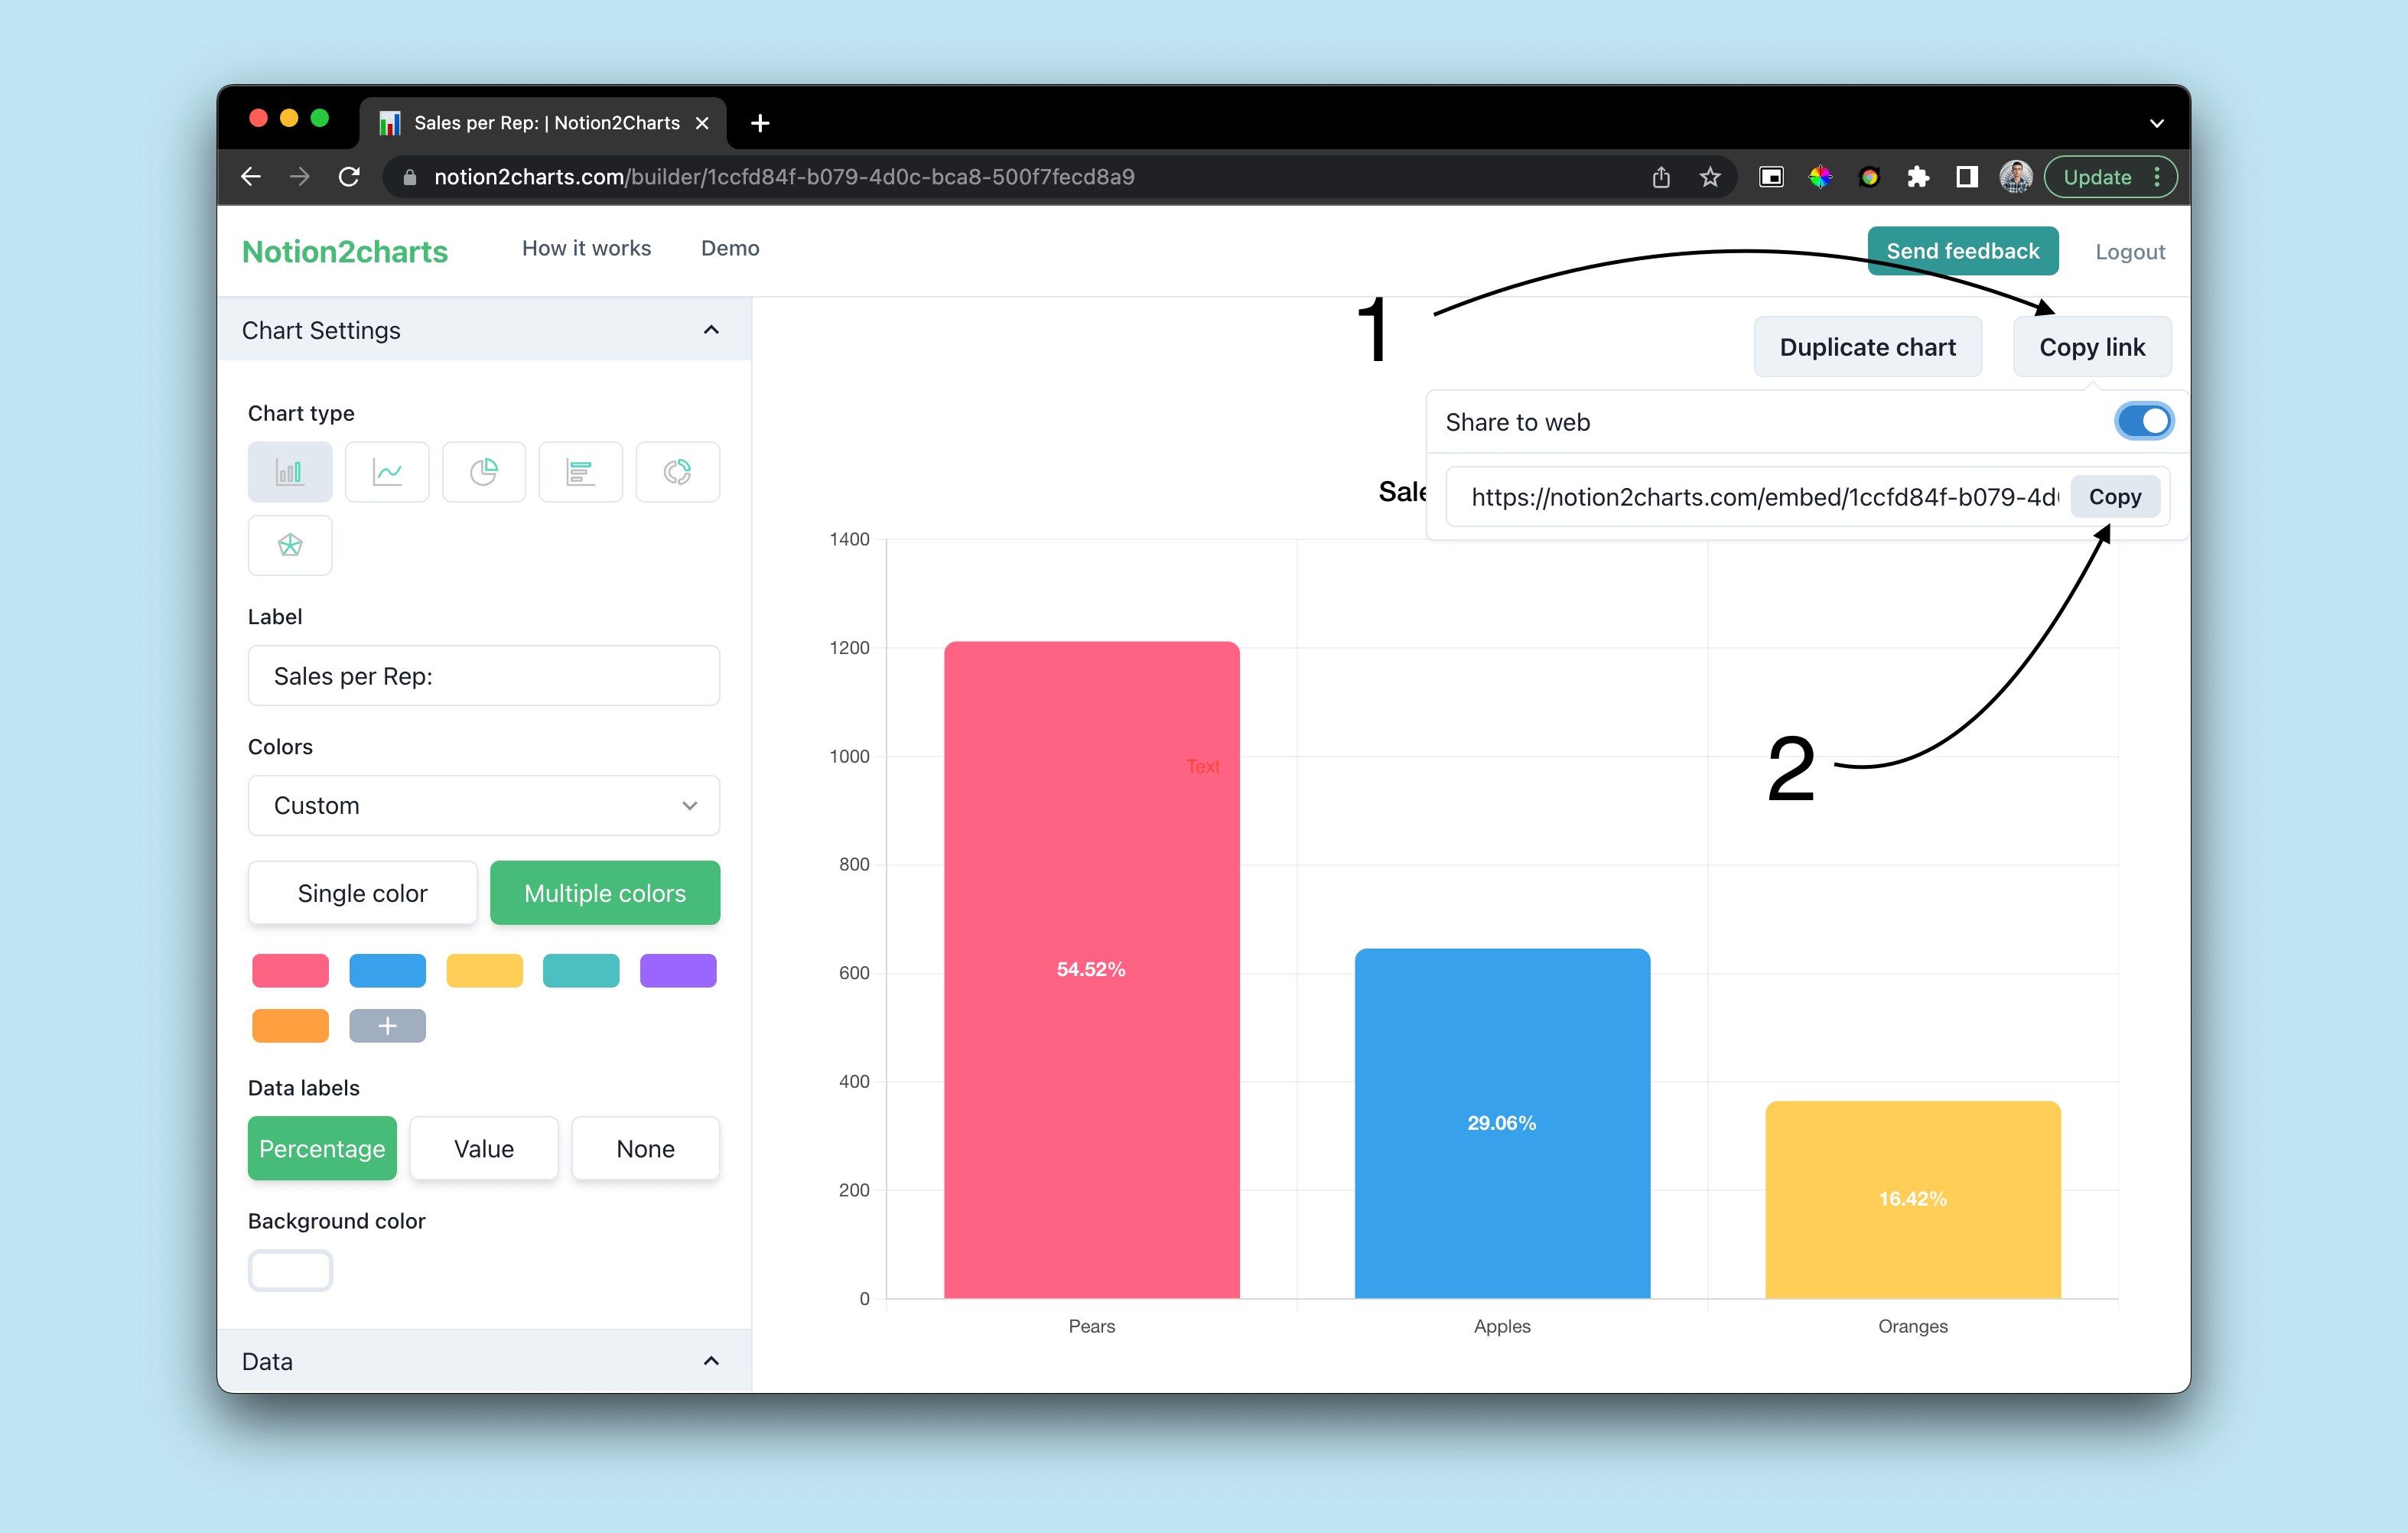
Now you can embed the chart in your Notion page by clicking "Copy URL" button in the top right corner of the chart builder and Enable public sharing.
Then, head over to your Notion page, paste the URL of the chart you just created and click "Embed" button.
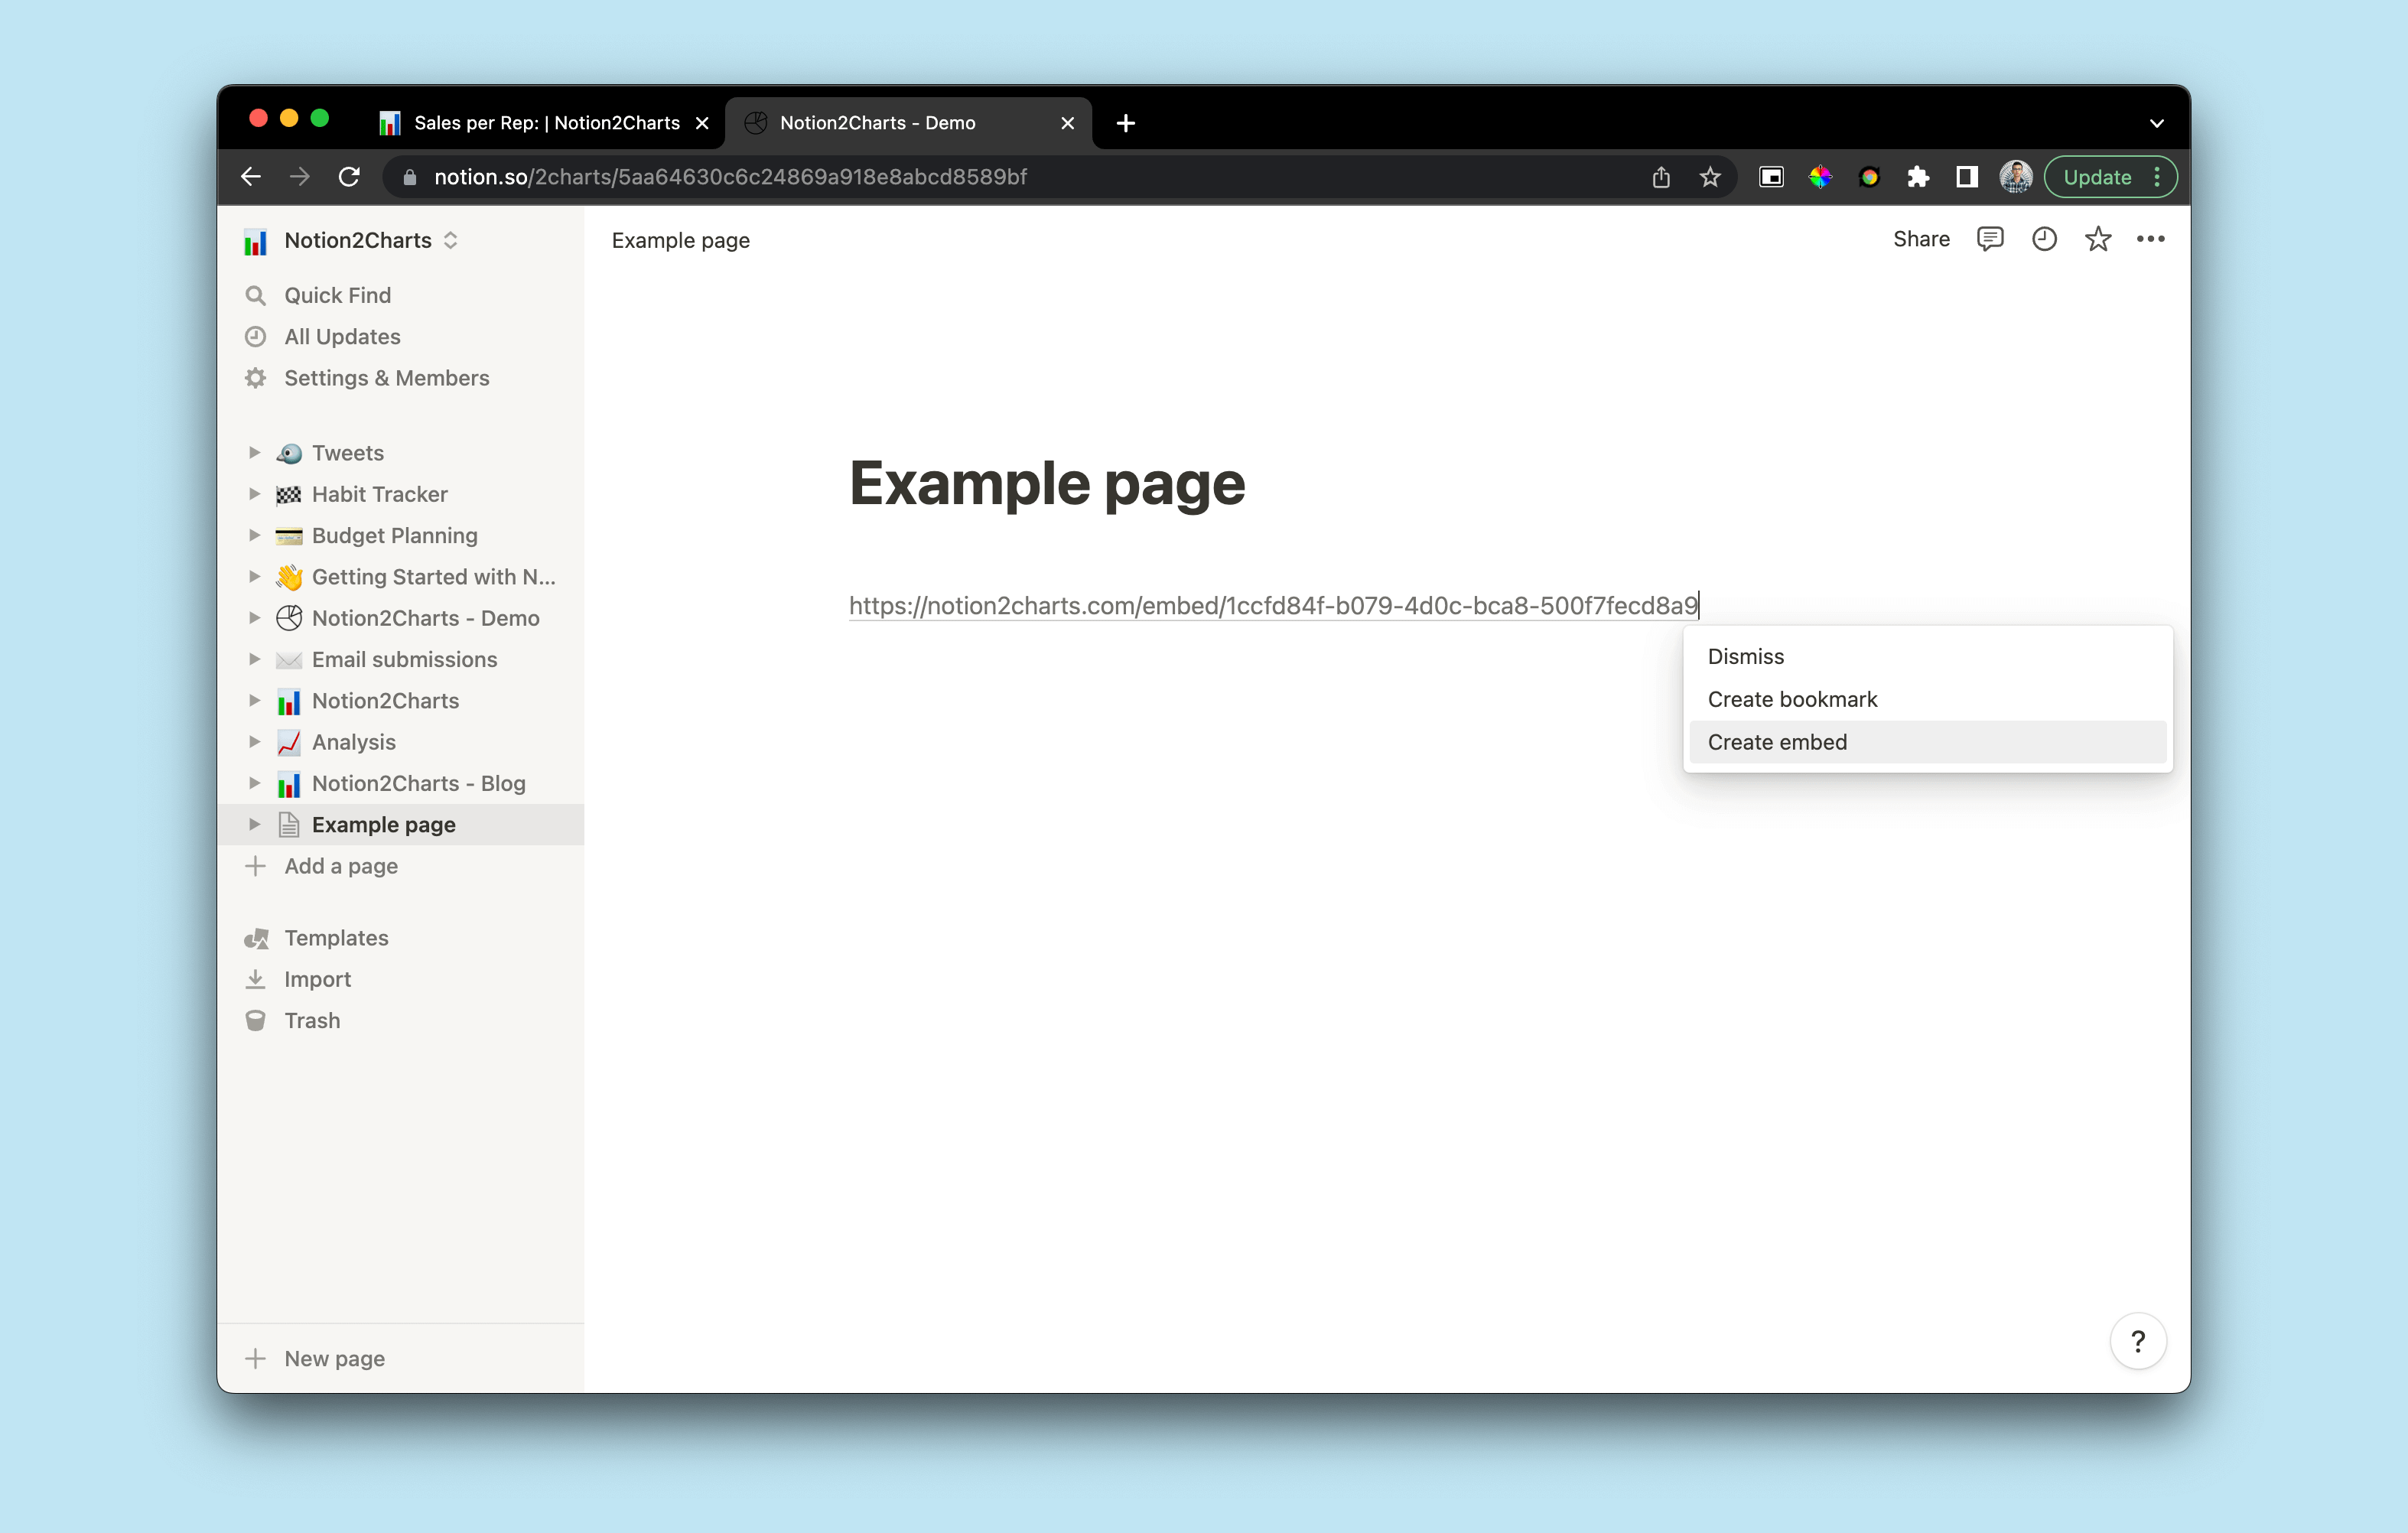
Voila! 🎉 You've successfully embedded the chart in your Notion page.
Latest Posts
Notion Charts: 7 Ways to Make Graphs in Notion
We share the best ways to turn databses into Charts - from ChartBase to LucidChart to GRID, we cover it all.
How to Create Charts in Notion: A Step-by-Step Guide
In Notion, you can't create graphs or charts from tables yet. In this article, we will show you how to create beautiful, dynamic charts from your Notion database using ChartBase, a tool that allows yo